
 RSS Feed
|
Another relatively quiet month in terms of economic news. The recent data has not done much to shift the views of forecasters very significantly. One of the special questions in this months survey was regarding the timing of the next recession. Ben Leubsdorf of the WSJ does a great job discussing those responses. The big movers this month are crude oil price expectations, which jumped 5.5 dollars for June 2018, and the yield curve spread, which narrowed some more. Oil prices through the end of 2020 are expected to rise but with diminishing amounts, with December 2020 forecasts only rising 1.9 dollars. The yield curve spread is actually quite fascinating as I have noted in past reports. 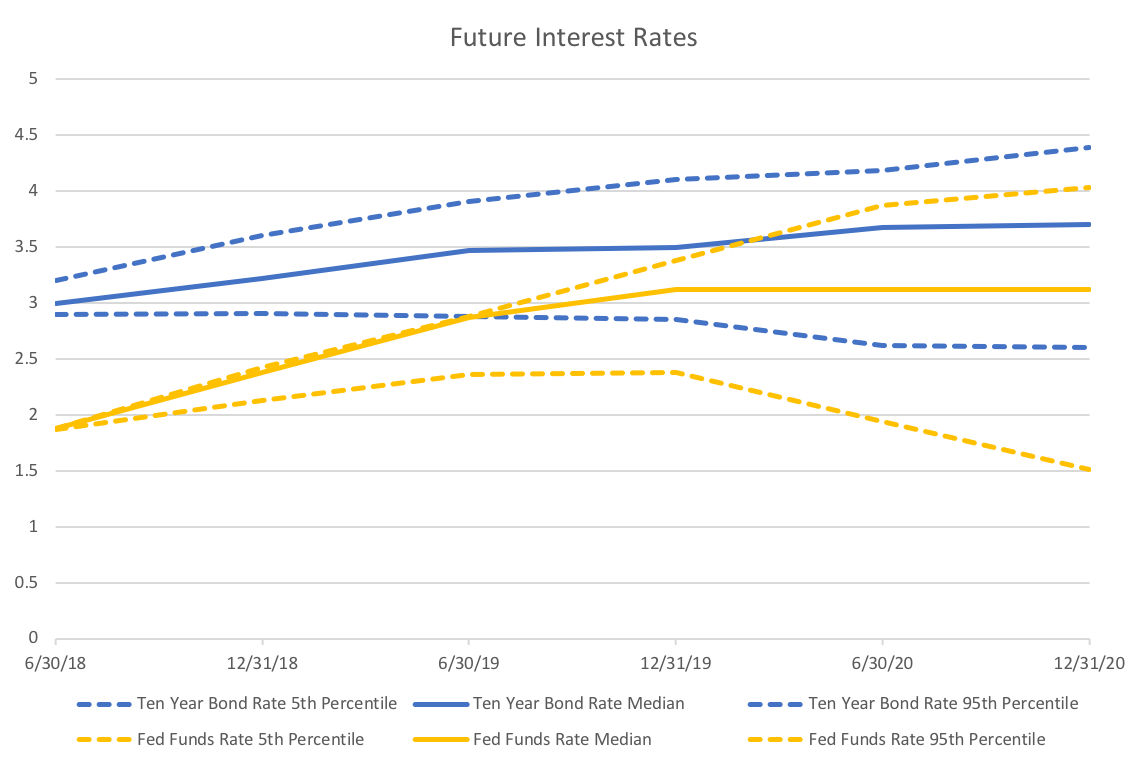 The graph above shows the yield curve tightening through 2020. More importantly, the variability of these forecasts is interesting as well. The difference between the 5th and 95th percentiles grows dramatically for the fed funds rate but is much more stable for the ten-year bond rates. It is unclear whether it is policy uncertainty or economic uncertainty that is driving this difference. However, it is strange that forecasters predict that the long rate will not respond, at least not one for one, to the stated Fed goal of raising rates at least two more time by the end of the year.
Another curiosity: even though the majority of forecasters expect a recession in 2020, they don't seem to think that the Fed will respond to it. If they did I would expect the median fed forecast to at least be fall from June 2020 to December 2020. However, the recession timing predictions are more or less consistent with the consensus unemployment forecasts hitting their low in mid to late 2019.
0 Comments
The Fed raised rates recently keeping their promise of raising the rate in the face of positive economic data. The WSJ forecasts corroborate this rosy picture of the future economy and improving their forecasts from last month.
The consensus GDP growth forecast for the coming four quarters rose by a tenth of a percent or more, and all future unemployment numbers went down. It also looks like the forecast for the turning point in unemployment is being pushed out until mid 2019. The consensus probability of a recession in the next 12 months dropped half a percent to 14.1 percent. Some of the details however do not indicate the same degree of certainty in the future economic position. The expected gap between the federal funds rate at ten year bonds continues to tighten signaling a flattening yield curve, which means the Fed may struggle normalize long rates in time for the next recession. Expected housing starts and housing prices dipped a little, but not enough to be overly concerning. Of course it is no surprise given political turmoil in Saudi Arabia, OPEC extension of production cuts, and now the North Sea pipeline problems, that expected oil prices increased significantly. Expected prices increased by 2 dollars or more through 2018. All in all, there is a strong belief amongst the Fed and professional forecasters that board scope economic futures look robust, but there are still some potential weaknesses. The most recent economic data continues to suggest a robust economy, and the WSJ Economic Forecasts reflect those facts. This post will present a brief overview of the changes in the average WSJ forecasts.
The main highlight from the GDP forecasts is a tenth of a percent increase in annual GDP growth for 2017, though only one quarter exhibited a decrease. Inflation forecasts also inched up in the near term (through 2018), but fell slightly post 2018. The positive employment reports have caused the predicted path of unemployment to shift down by almost a tenth of a percent as well, but the predict peak of employment is still around the end of 2018 or beginning of 2019. The probability of a recession in the next 12 months decreased by more than one percentage point to 14.6 percent. The expected spread between the ten-year bond yields and the federal funds rate continue to tighten. This means that the yield curve may flatten out over the coming years. If that comes to pass monetary policy makers will not have as many tools at their disposal for the next recession since they will only be able to impact the short end of the yield curve. End-of-year expected crude oil prices jumped up by over 3 dollars, however, longer term forecast rose more moderately. Housing price growth forecasts continue to increase. The end of the 2017 consensus is now expected to reach 6 percent. However, expected housing starts declined slightly through 2019. All in all, the recent data has moved forecasters to have a generally bullish view on the future economy. The new WSJ forecasts were released last Friday and it looks as if the recent data has caused the forecasters to be pessimistic about the short-term, but optimistic about the long-term. Forecasts for inflation and unemployment through 2018 worsened (unemployment ticked up, while inflation decreased), but consensus predictions for for both variables in 2019 improved. In addition, only the last two quarters of 2017 GDP growth were revised downward, and all subsequent quarters and annual projections rose. These general macroeconomic indicator forecasts were somewhat at odds with the changes in specific indicators like the ten-year bond rates and crude oil prices. Bond rates were all revised downward, despite increases of the expected federal funds rate in 2019. Crude oil prices are still expected to rise slowly over the next two years, but only reaching the low 52 dollar mark, instead of 53 or 54 from a couple of months ago. Despite the lackluster September employment report, payroll forecasts for next year rose by over 10,000 to 16,080. These numbers suggest that the recent data implies that the economy is sliding a little below the long-run growth path. As I pointed out while discussing the recent payroll report, long-run time-series dynamics seem to be dominating current forecasting (as opposed to structural modeling and forecasting). I believe these recent round of forecasts supports that idea, because this pattern of revision is consistent with the behavior we observe. To see what I mean look at Crude Oil Price forecasts: 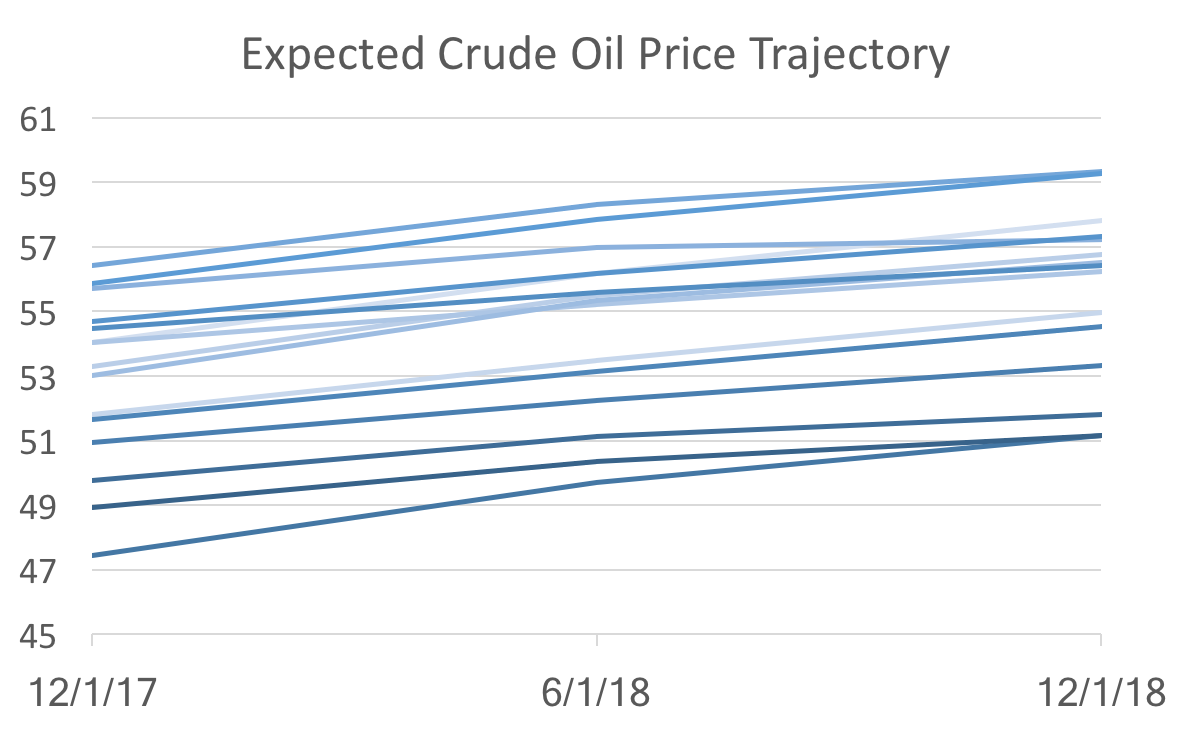 The graph above shows forecasts at different points in time (light to dark indicates old to new). All we see are level shifts (the intercept) holding the dynamics (the slope) the same. That suggest the new data are not changing anything about the fundamentals, which would alter the trajectory, but instead only reveal changes in the starting point of a more or less unchanged dynamic system.
But is that good news or bad news? The good news: there really isn't any bad fundamental news. The bad news: models based on dynamic systems are correct on average, but since they are essentially data driven, it makes forecasters appear to be agreeing with each other. So the recent drop in forecast uncertainty (defined as the standard deviation amongst forecasters), does not necessarily indicate that we know a lot about where the economy is heading. A logical analysis of expectations might argue that historical averages drive long-run forecasts with macroeconomic fundamentals and announced policies providing slight mitigation. In contrast, recent economic data drive short-run forecasts. WSJ expected inflation for 2017 provides a good example of this: 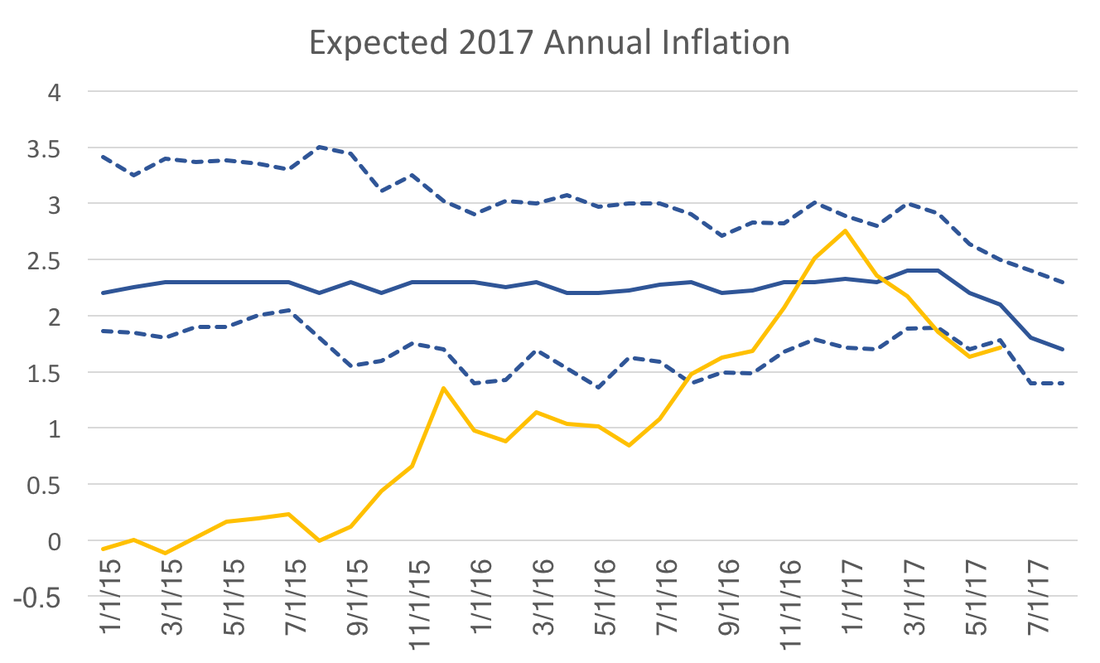 Almost 3 years in advance, the forecasts match the Fed's stated policy and historical averages. At the beginning of the 2017 it looked as though year over year CPI inflation (yellow line) and expectations were converging. However, the last few months of slow price growth have caused expectations to dip following, with a lag, the path of year over year inflation. This post points out that this pattern of behavior need not exist for all variables. 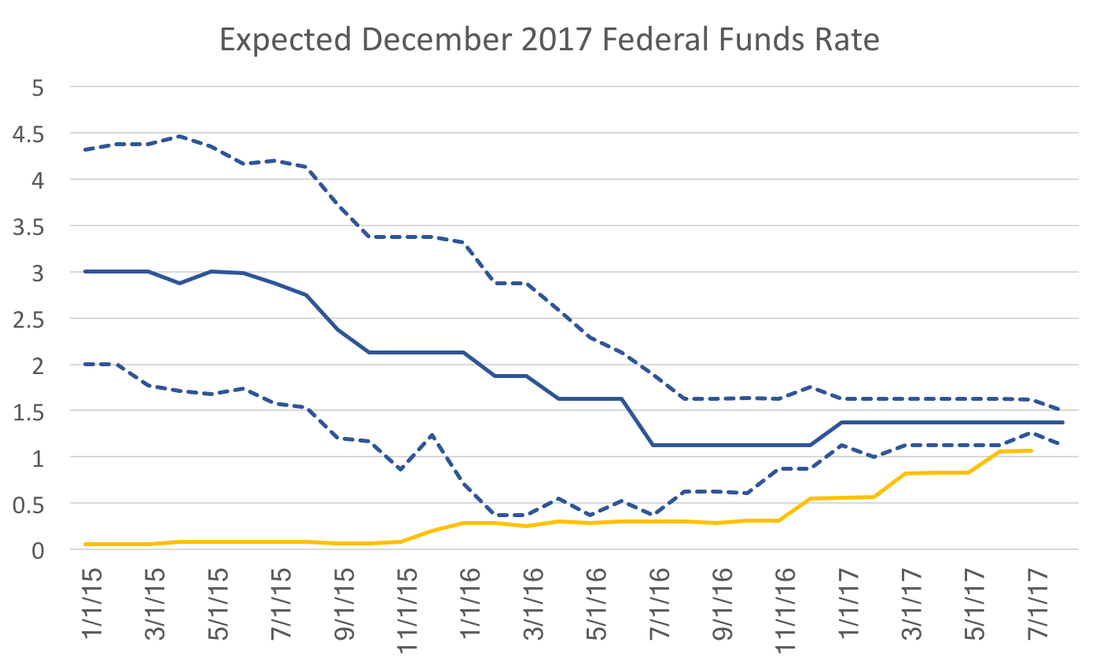 Instead consider the federal funds rate. These expectations, more so than those for inflation, driven by mostly by policy statements and projections released by the Federal Reserve. It is therefore not surprising how high expectations were at the beginning of 2015 and how quickly they have fallen over the past 2 years. In 2015 the discussion was over normalization of policy or "the lift-off," but the data at the time did not support action at that time. As policy statements and Fed projections became more clear expectations dropped quickly. Notice also the drop in uncertainty, a point I have emphasized in a previous post on federal funds rate expectations. The drivers of inflation and the federal funds rate have no direct impact on the bottom line of the forecasters or the firms for which they provide their forecasts. However, take ten-year government bond rates for example: 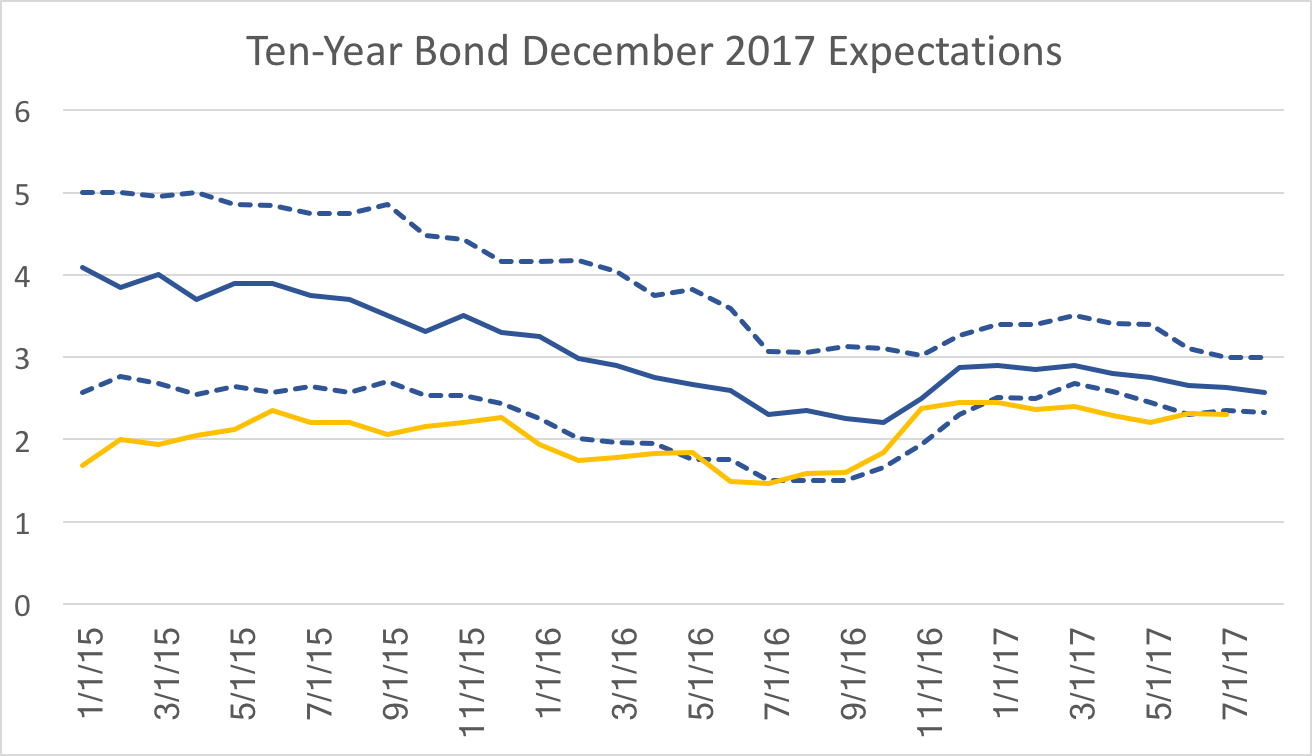 These expectations more closely follow the path of the actual bond rates even 2-3 years in advance of the realization. While bond rates should, in theory, be just as sensitive to monetary policy one would expect a similar pattern, however the gap observed at the beginning of this series does not appear as wide and the overall time-series movement between expectations and actual observations are remarkable similar.
How we think about long-run and short-run expectations depends critically on the relative importance of the outcome to our objectives. A couple of months ago I wrote about the surprising decline of Federal Funds rate uncertainty in the WSJ economic forecasts. This post revisits that topic presenting a revised version of the data. Unfortunately, the revisions do not look as favorable for the Fed, but it still looks as though the Fed is effectively communicating their policy trajectory. 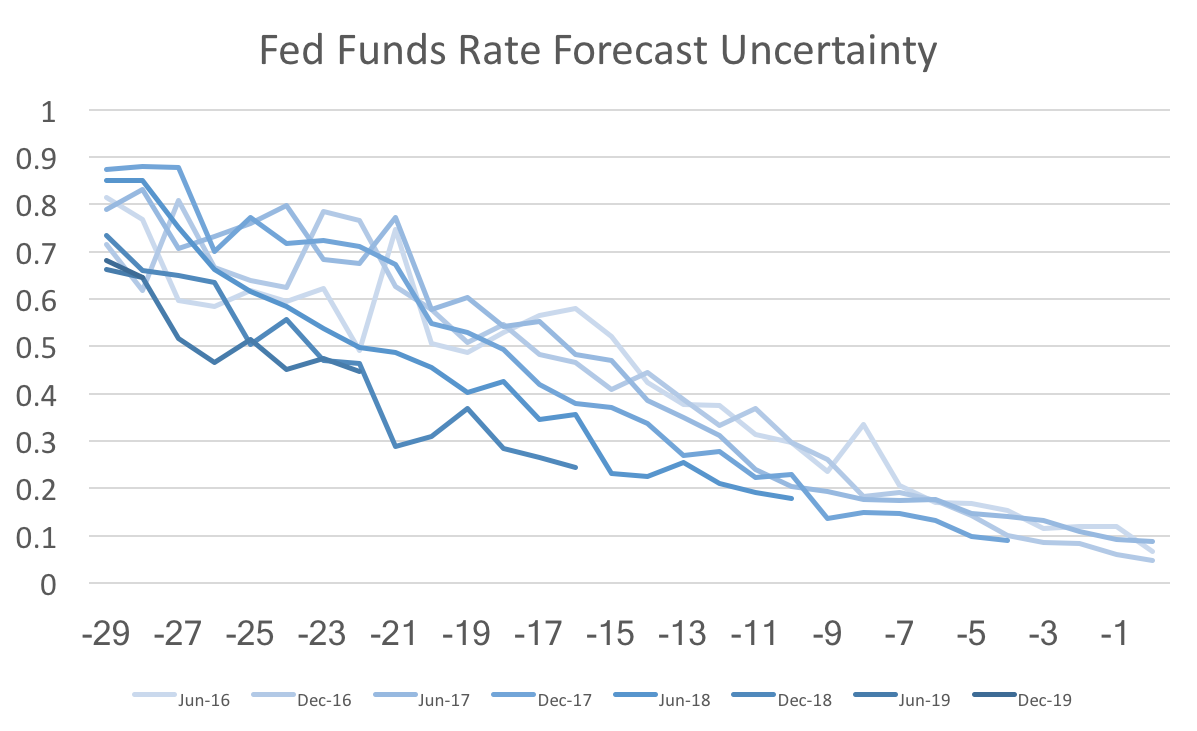 The graph above shows forecast uncertainty (std deviation of fed funds rate forecasts) for several future forecasts. The x-axis is the number of months out from the date being forecast. The striking feature of this graph is that the darker lines have shifted lower over time. This is more or less what I discussed in that previous post. However, when I looked back at the data (with the new forecasts add in) I noticed some anomalies and reweighed those results by the standard deviations of the payroll employment forecasts. 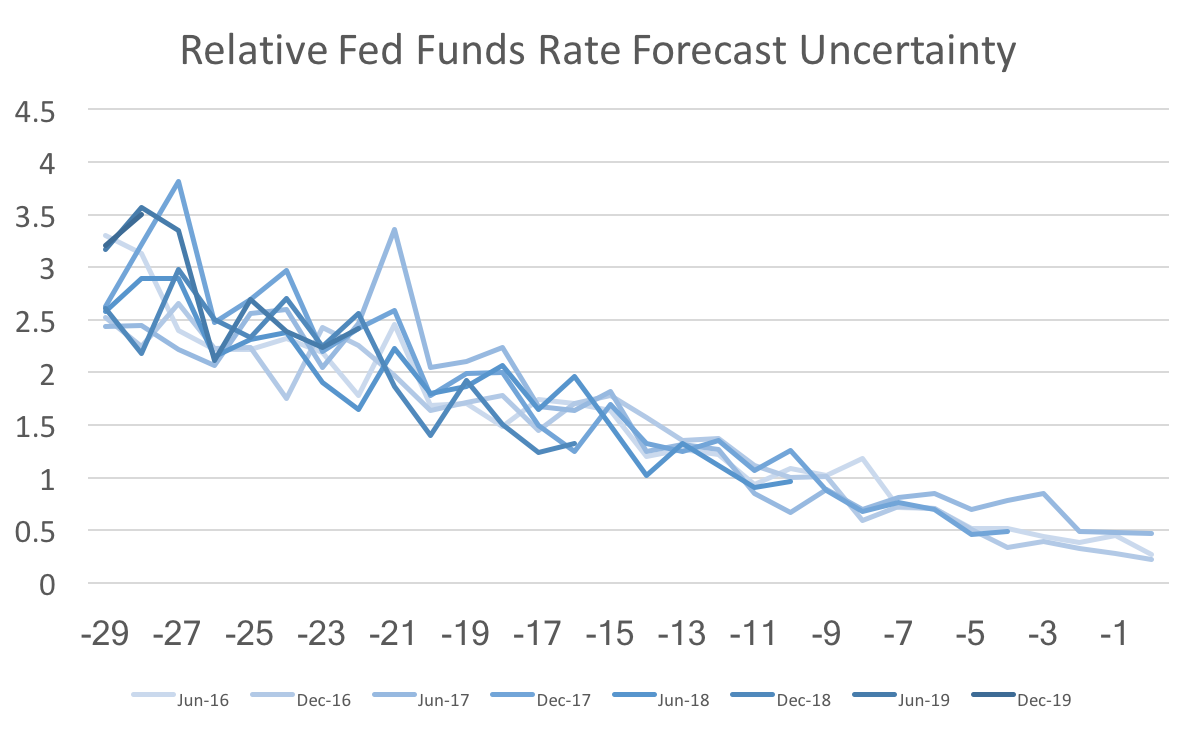 Once we recalculate federal funds rate uncertainty relative to the general level of uncertainty we find almost no change in fed funds rate uncertainty. If instead we calculate the same relative uncertainty for 10-year bonds, then we actually find that forecast uncertainty for 2019 is higher than normal: 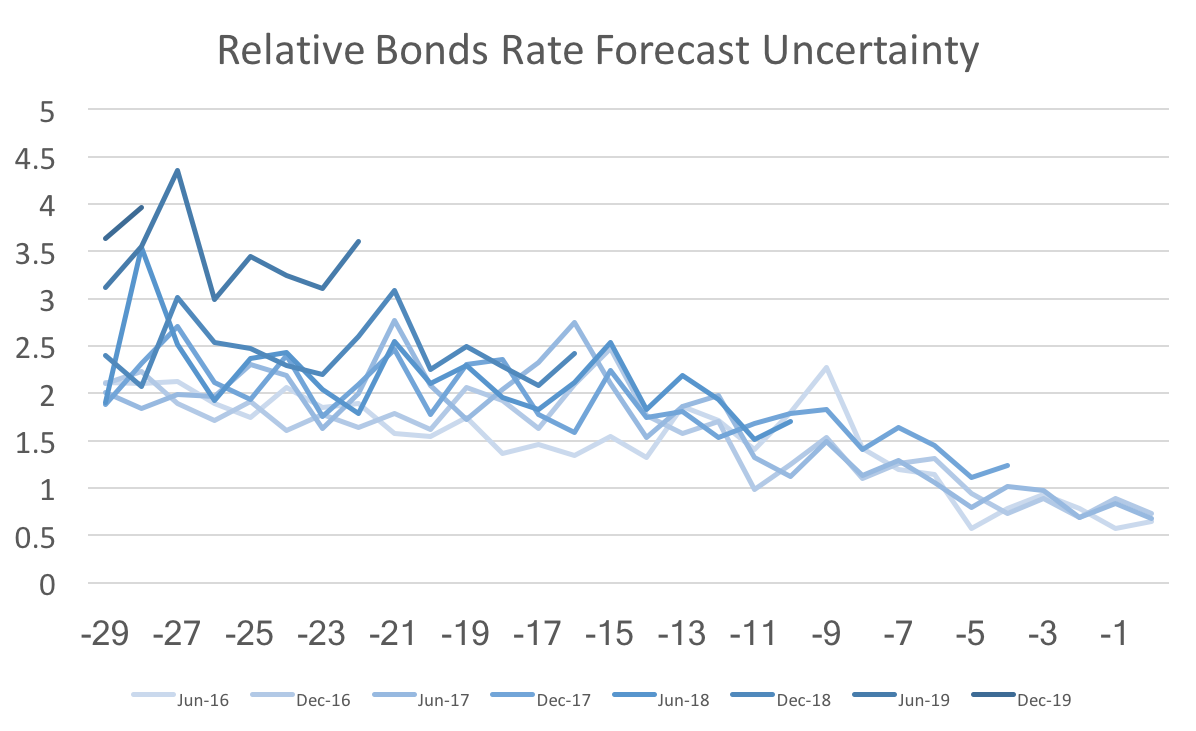 Since there has not been a dramatic shift in the more recent 2018 and 2017 forecasts, I suspect that the additional uncertainty is due to some forecasters projecting a recession (or at the very least a slow growth economy) while others foresee a continuing economic boom. To further support that claim we can see a similar pattern in quarterly GDP forecast uncertainty: 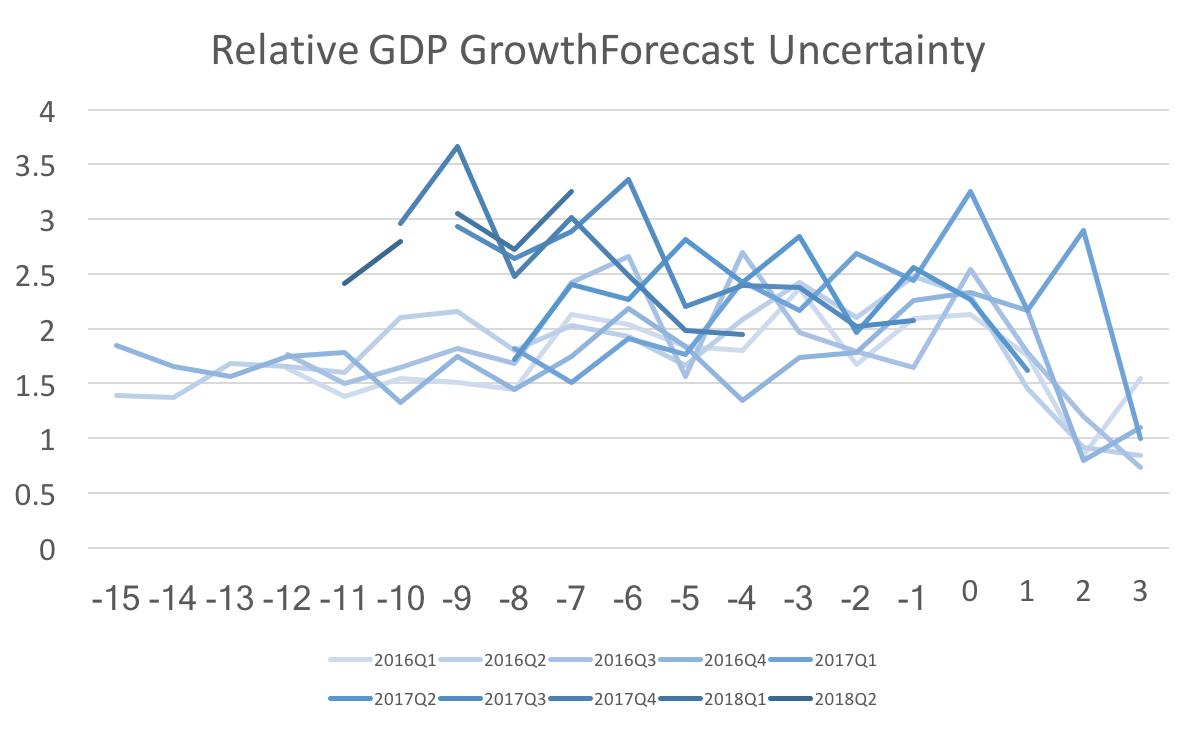 The forecast uncertainty of the Federal Funds Rate has remained similar to the past, relative to payrolls uncertainty. However, other variables appear to be getting more uncertain relative to payrolls uncertainty. For those facts to line up forecasters must understand and believe the Fed's announced policy trajectory.
Economists model the economy, which really means we model thinking and decision making. A post from a few weeks ago showed that professional forecasters display less future federal funds rate uncertainty. Could this reflect a more general trend of individuals having more information about the federal reserve system? The most visible member of the Federal Reserve is the Chair, and google trends provides excellent data on the relative frequency of Fed Chair searches: 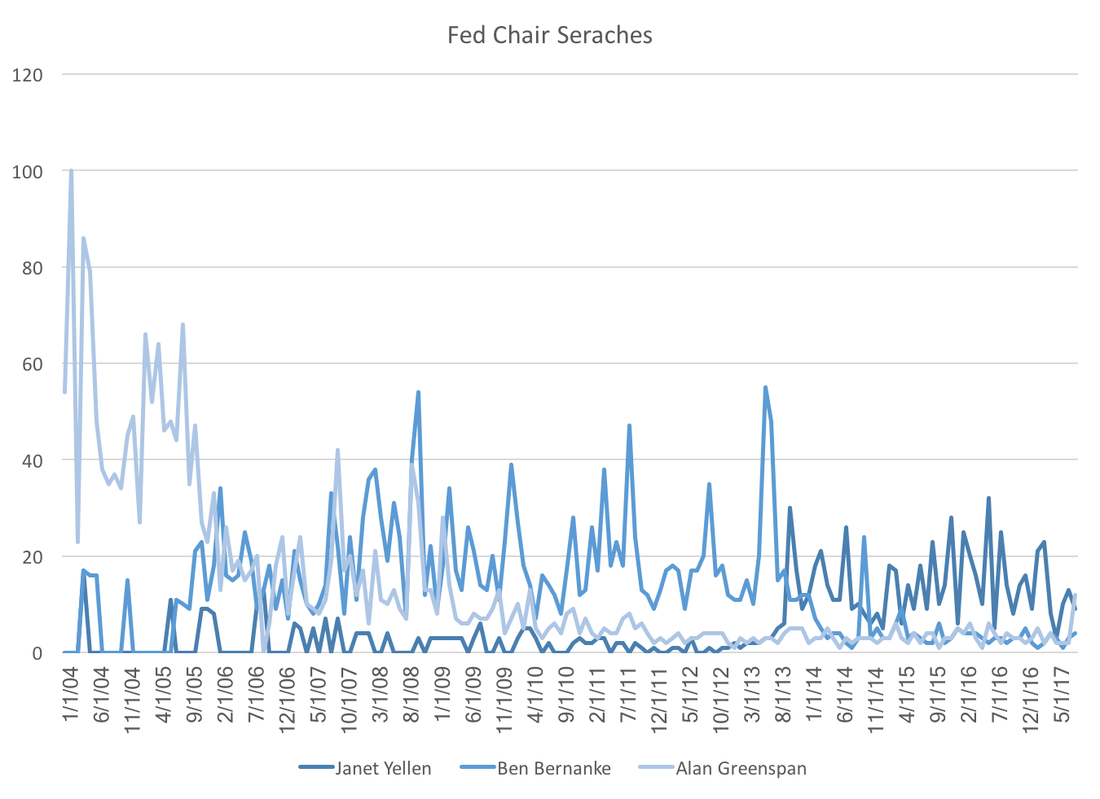 As each chair transitions we see the appropriate shifting of search traffic from one person to the other. The notable difference the relatively low number of searches of current chairwoman Janet Yellen. It appears this is an artifact of declining interest in the Federal Reserve searches in general: 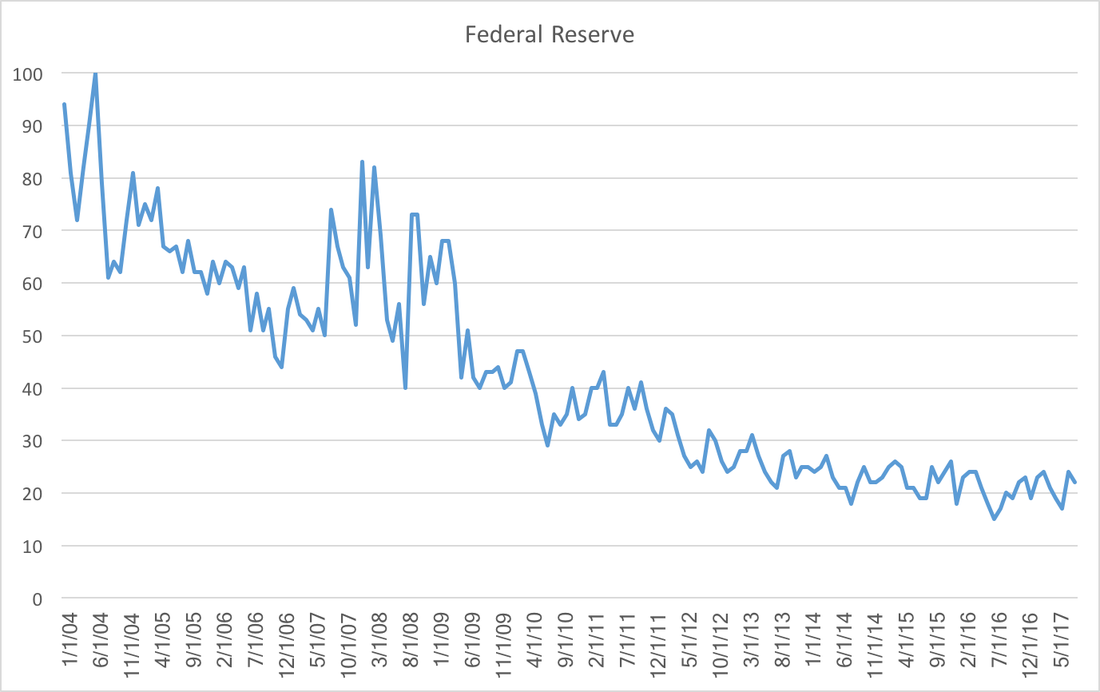 Re-weighting the first graph by the second we see that relative to Federal Reserve searches, Janet Yellen has been searched for at least as much previous Fed Chairs: 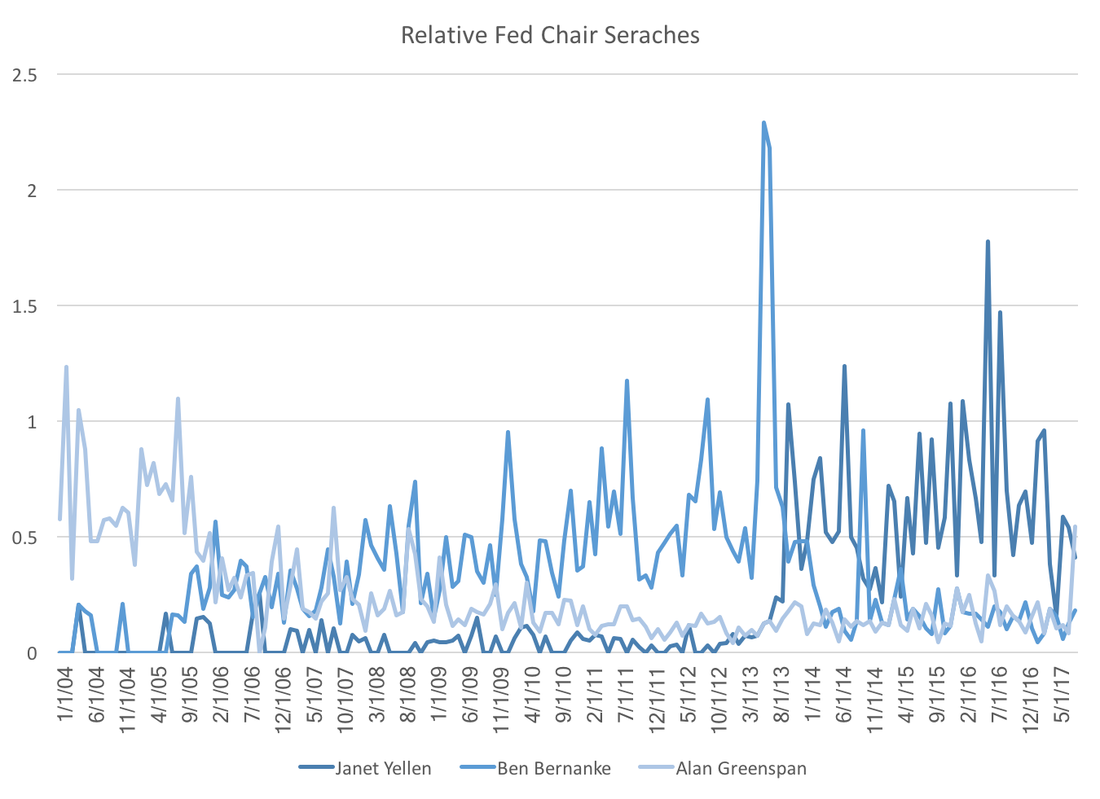 While it is nice to know that there does not appear to be a gender bias, a puzzle remains. Why has fed funds rate forecast uncertainty decreased while interest in the federal reserve has waned? Perhaps searches have declined because the Federal Reserve has done a better job at communicating future policy, which eliminates the need for gathering additional information.
The recent release of second quarter GDP growth came in below WSJ expectations as well as a downward revision of first quarter growth (from 1.4 to 1.2). This new data follows weak inflation numbers from last week. 1. For the past two years expectations exhibit an upward bias. Which, if that bias holds true, means low future expected growth would indicate even lower actual growth. Projected growth in 2018 is 2.38 percent, and 1.94 percent in 2019. These are significantly below the administrations overly optimistic 3 percent promise. 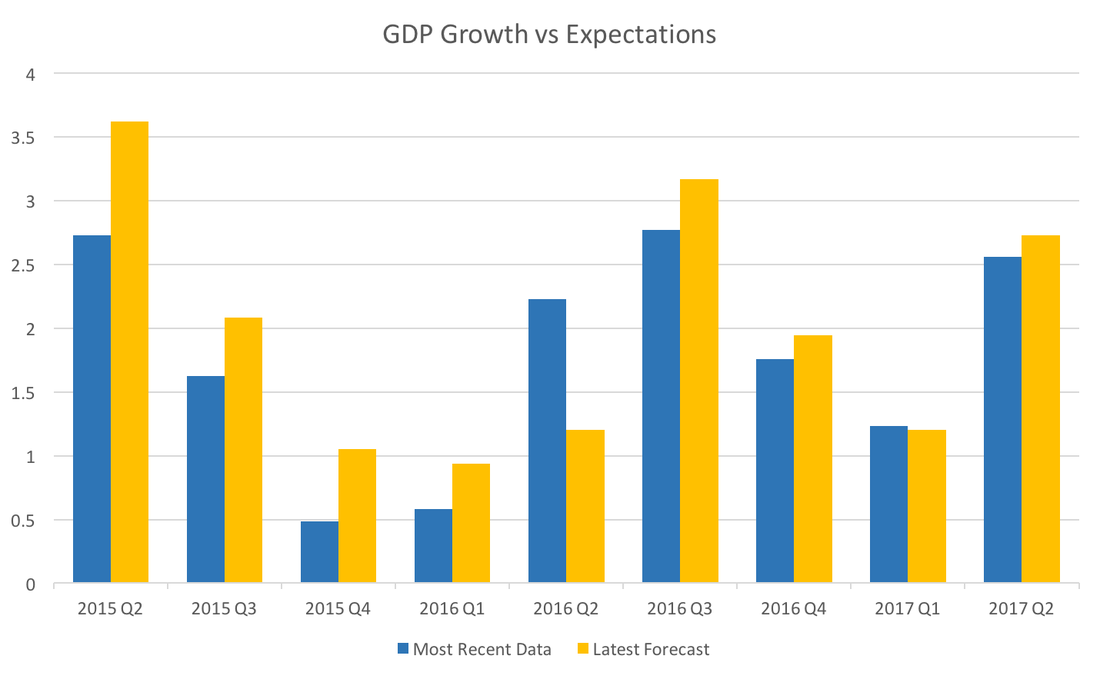 2. Expected federal funds rates have been falling since the beginning of the year. Not by a lot, but it has been consistent, suggesting that new data will give the Fed pause in increasing their target rates. 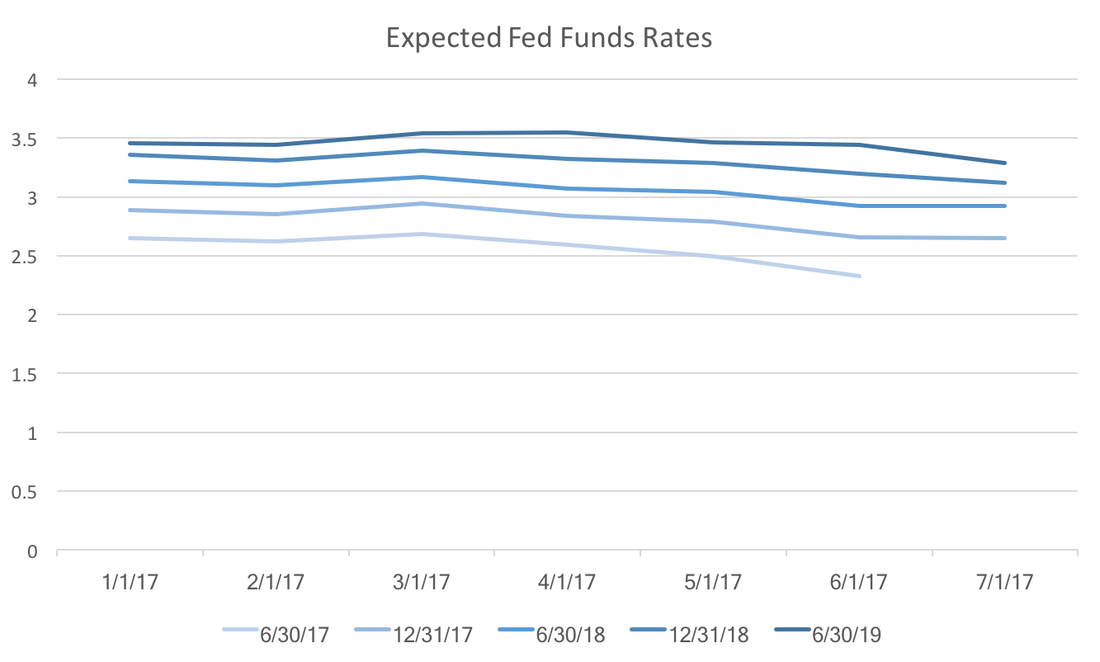 3. Expected housing starts continue to fall. At the beginning of 2016 expected housing starts were quite robust, however, subsequent data have curtailed consensus optimism. If this expectation falls below 1200, that could be a signal the beginnings of a slow down in the housing market. 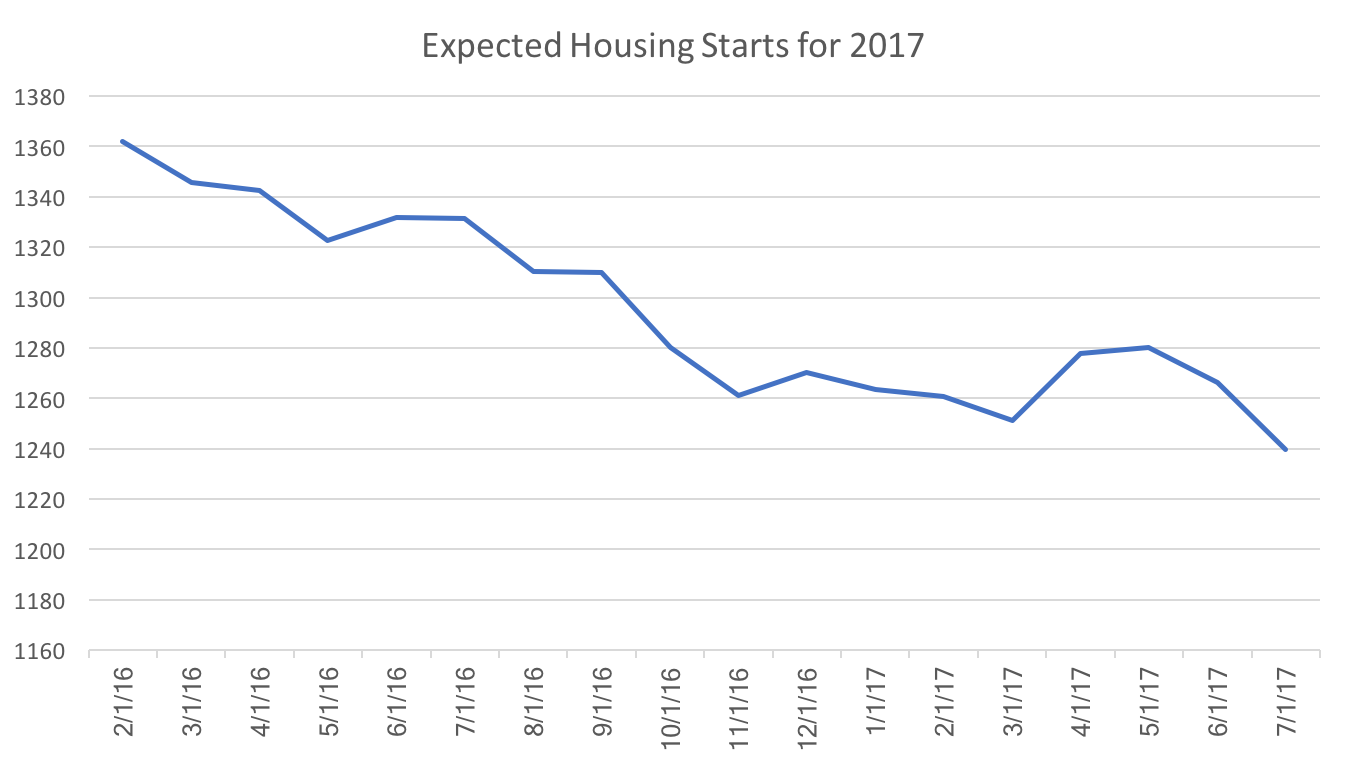 While there some signs of growth remain, these three sets of expectations should worry investors and the current administration. All indicate at the very least, that the economy will not grow particularly quickly in the coming year. In the worst case scenario we may see the beginnings of a recession by the end of 2018.
Over the past year there has been less disagreement across forecasters predicting the Federal Funds Rate, and unemployment. Not surprisingly as the forecast horizon (the time between the forecast and it's realization) decreases the agreement among forecasters increases. That is, there are fewer outliers because more is known. The WSJ Economic Forecasts display this property, however, using the payrolls employment forecasts we can isolate the changes additional variation outside of the monthly uncertainty. The graph below plots the normalized standard deviations for Employment Payrolls, Inflation, Federal Funds Rate, and Unemployment forecasts. 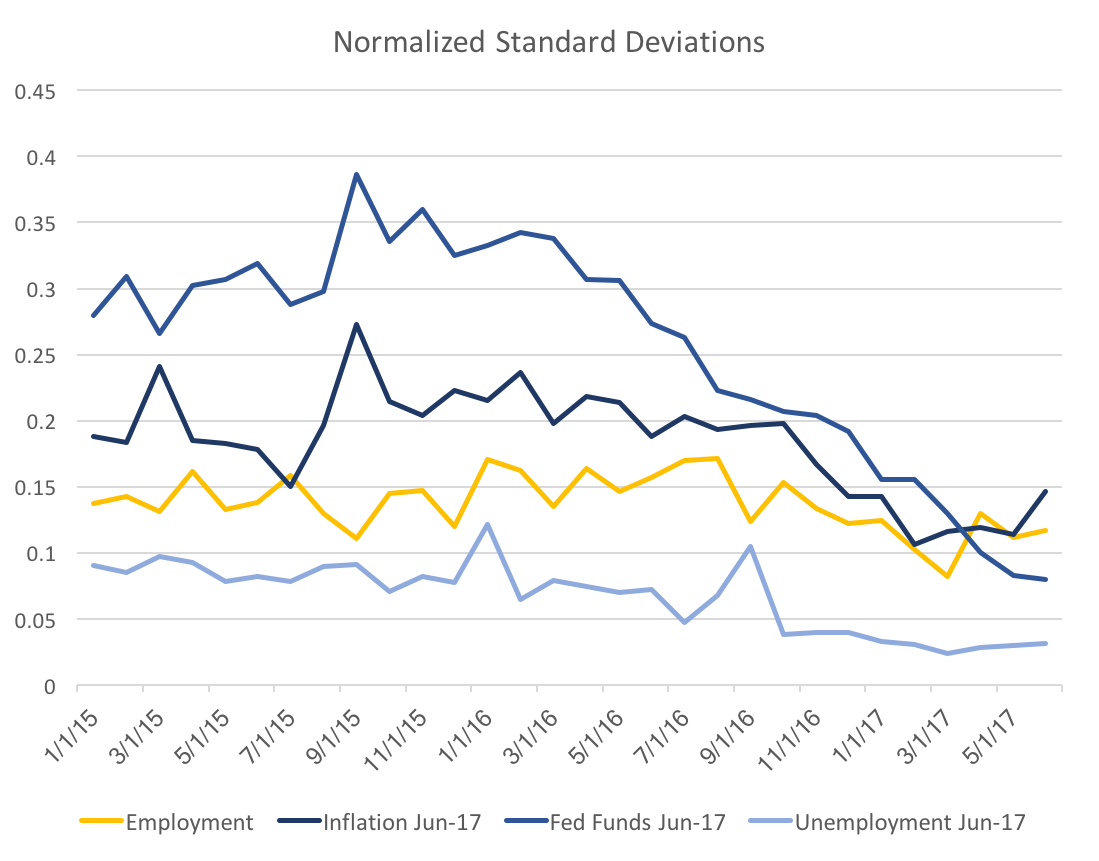 The yellow line of employment payrolls is stable, with a slight decrease in the past half year. In contrast, the Fed Funds Rate exhibits a very steep decline from a year ago. This is likely due to increased consistent messaging amongst FOMC participants as well as improved (and consistent) fundamentals. A large portion of the decrease is likely just due to the shortened horizon. The following graphs will display the forecast variability over all the forecast horizons. 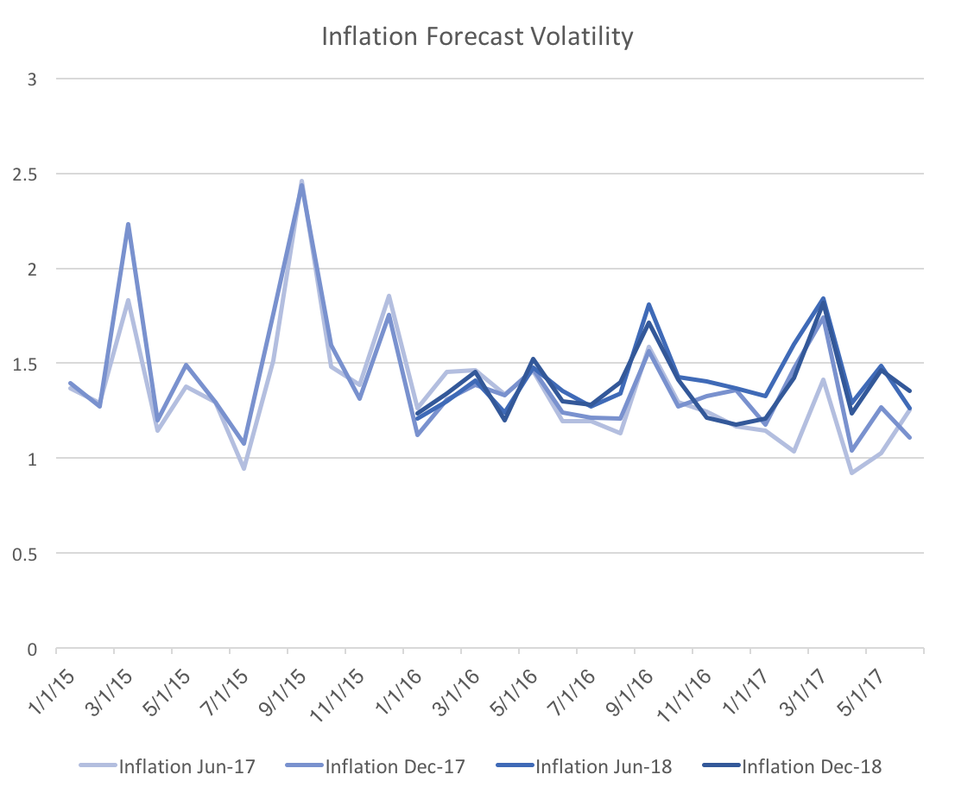 The graph above shows the four forecasts of inflation. Clearly once we control for the general uncertainty the slight downward trend of inflation forecast variability disappears. However, the graph below shows that that the downward trend very strong for the Federal funds rate forecast variability. 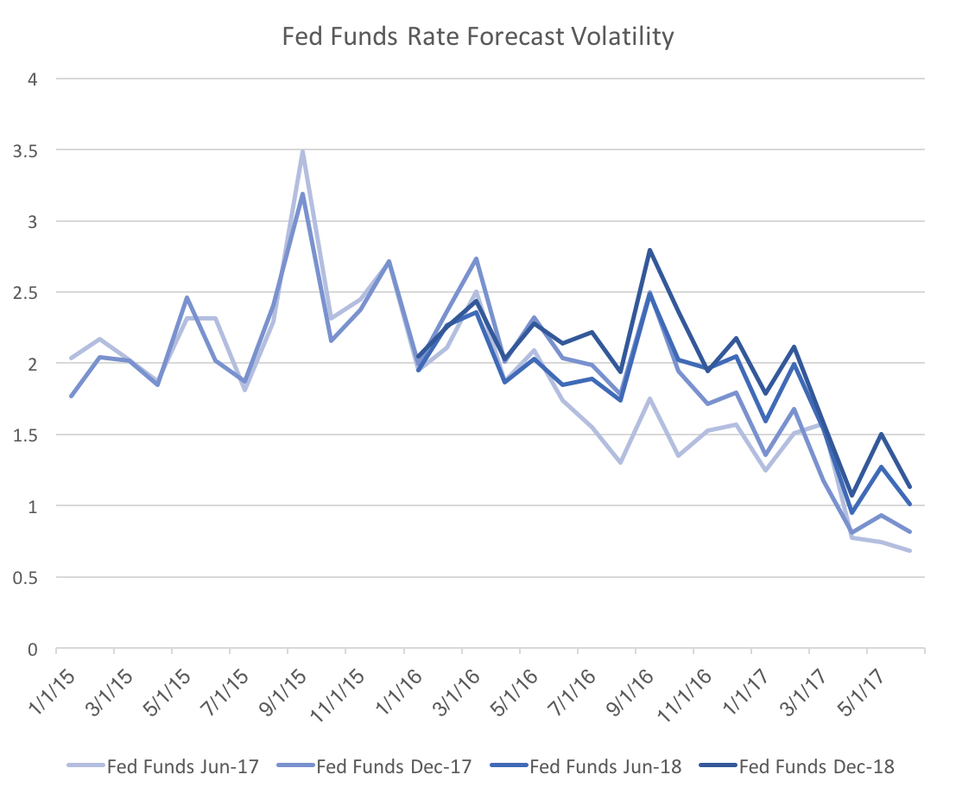 Also note that the drop is across all four forecasted dates, which implies that the result is not a normal change over forecasting horizons. Fed officials should be encouraged by this graph because it suggests the consistent messaging may be consolidating interest rate forecasts. 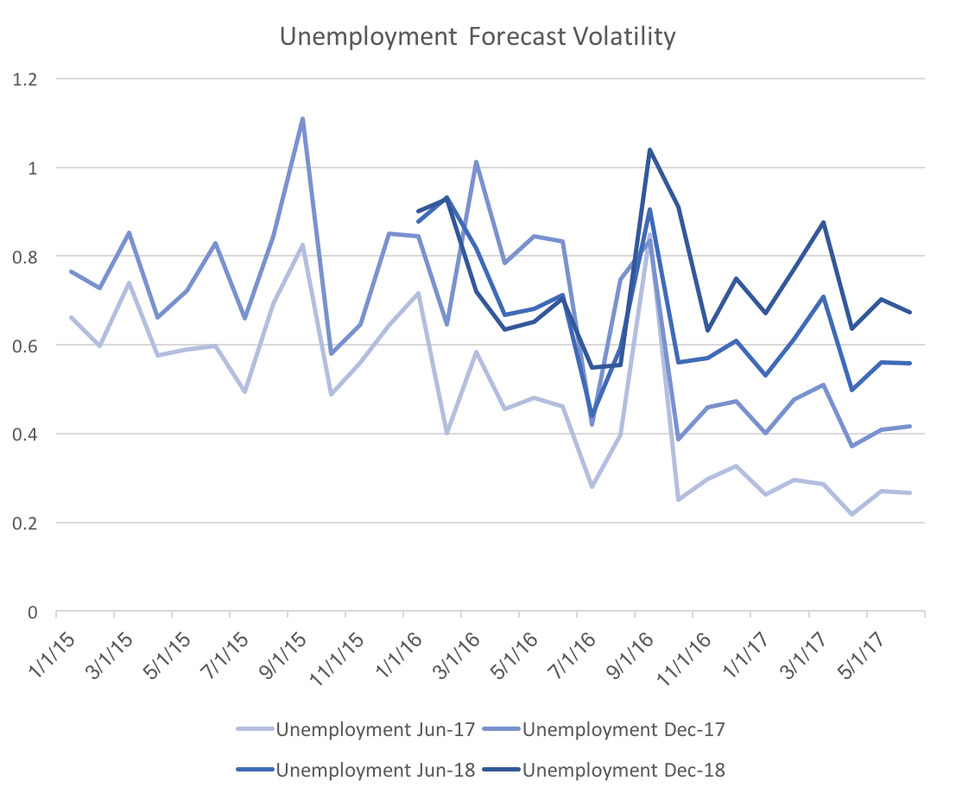 We see a similar, but slightly different graph for unemployment. Again it looks as though all four forecasted dates are decreasing in forecast variability. The main difference is that there is clear stratification across forecast horizons. From this graph it is unclear whether forecasters truly are more certain, however, I suspect the clear stratification across forecast dates indicates a typical spread of forecast horizon uncertainty.
On June 14th the FOMC decided to increase the Federal Funds Rate. This move was almost perfectly anticipated by the WSJ Economic Forecast Survey participants. However, a close look at their revisions to the future rates has them leaving the Fed funds rate mostly unchanged, but seeing significant declines in Ten-year bonds particularly in the short term. The graph below shows the changes in expected interest rates through the end of 2019. 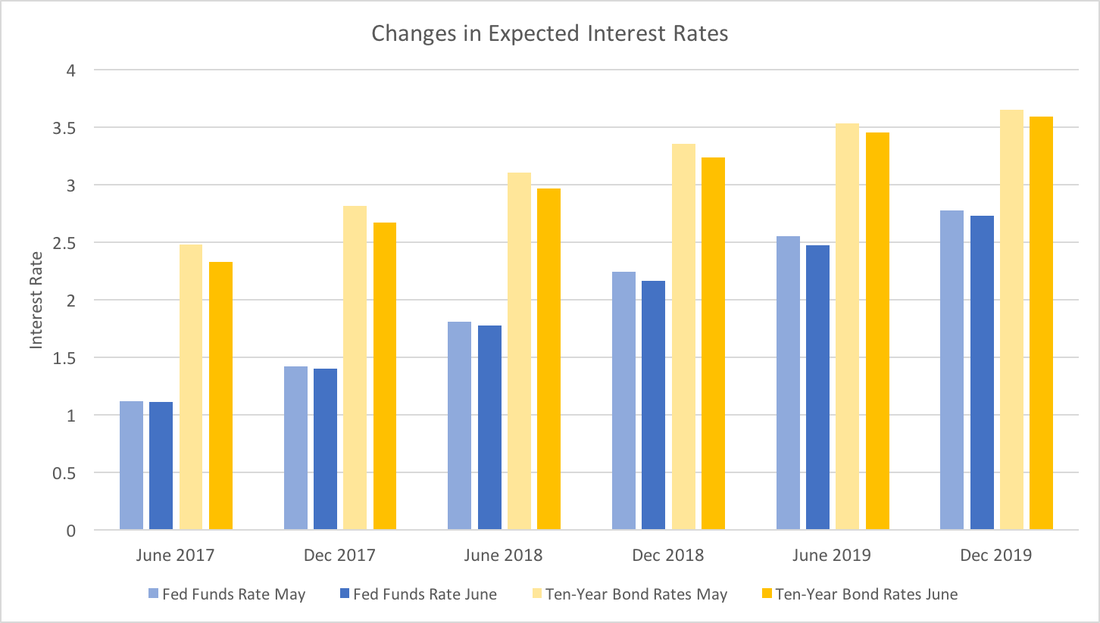 While June and December 2017 Federal funds rates forecasts are almost identical, the Ten-year Bond rates have dropped significantly. This could reflect greater certainty over Fed policy, and less perceived economic risk in the short-term. That is, the Fed has been effectively communicating their criteria for raising rates and participants forecasts have not seen a reason to change the projected path. Since the data have been, for the most part, positive, forecasters believe the bond markets will incorporate the lower economic risk into the bond rates. Taken as a whole, this suggests that expectations about the short-term future economy are good.
Turning to the longer-run (in 2019), both expected rates have dropped slightly. Given the long forecasting horizon it may only reflect reversion to the mean (what goes up must come down). However, I suspect that forecasters recognize that while the economic data has been positive, it has not signaled robust growth. Essentially, we are still (very slowly) climbing out of the hole the financial crisis created and we should continue to do so for the next two years or so. |
Archives
May 2018
Categories
All
|