|
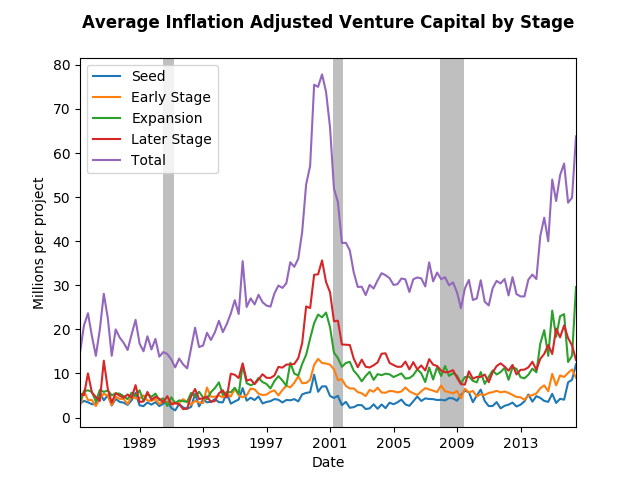
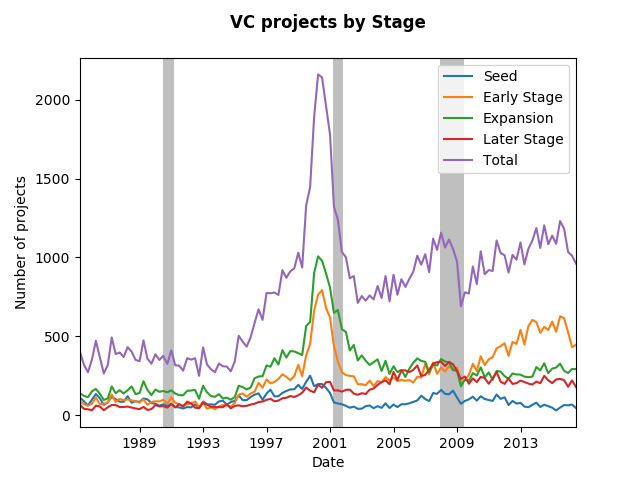
Using National Venture Capital Association Data we can see what has been going on in venture capital. The data the provide has four stages of development, and they provide both the total amount of money invested plus the number of projects funded at each stage. Using that and the consumer price index (the graph would be similar using another price index) we find the average inflation adjusted venture capital project in the graph below. We can see the tech bubble very clearly, but the flat trend that followed might surprise you. It surprised me. The amount of seed money has more or less remains the same, but the later stage contributions from VC's have almost tripled since the late eighties. One can only assume that the tech moguls who earned their millions (nay billions) in the nineties appear to be giving back. In addition, the great recession was but a mere speed bump in the VC world at least in terms of amount spent per project. In fact, in terms of total number of project funded, the great recession had a major impact as the graph below depicts. Note, that the number of Early Stage VC projects drive the recovery from the recession, however, all stages appear to increase in funding over the past few years. The expansion stage has not started ramping up like the previous bubble, therefore the recent changes in average funding rates reflect the strengthening economy.
1 Comment
|
Archives
May 2018
Categories
All
|

 RSS Feed

