
 RSS Feed
|
A couple of months ago I wrote about the surprising decline of Federal Funds rate uncertainty in the WSJ economic forecasts. This post revisits that topic presenting a revised version of the data. Unfortunately, the revisions do not look as favorable for the Fed, but it still looks as though the Fed is effectively communicating their policy trajectory. 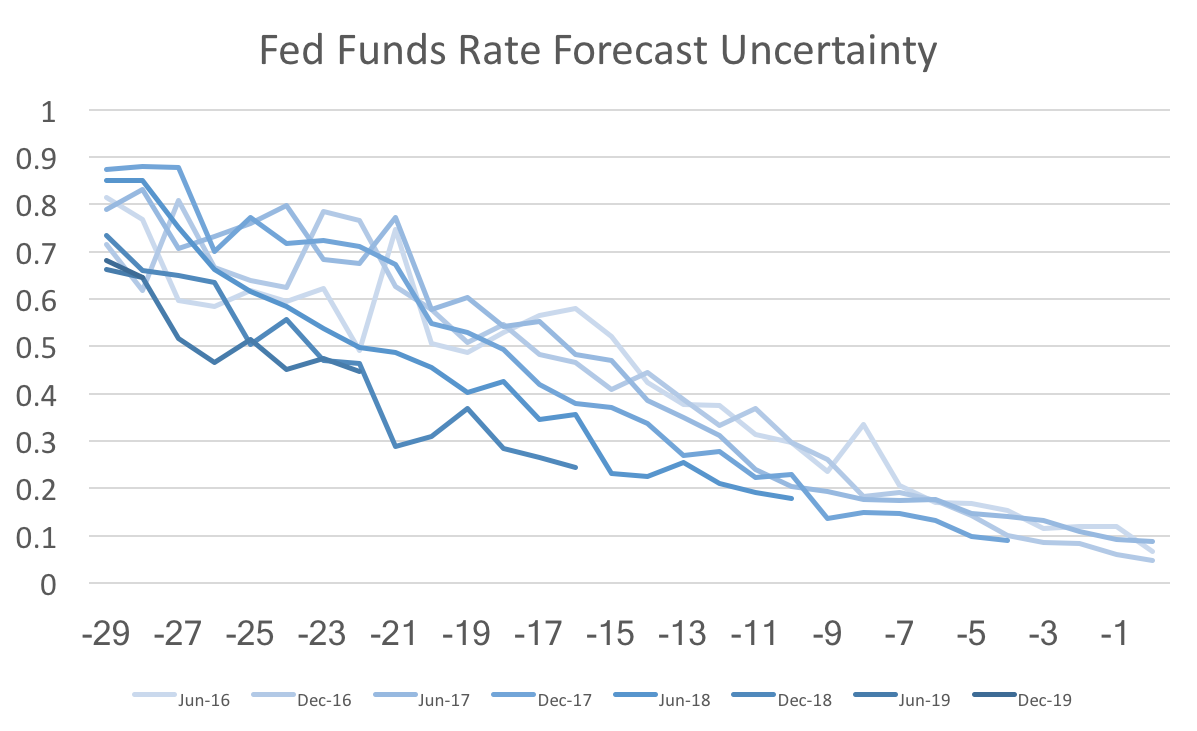 The graph above shows forecast uncertainty (std deviation of fed funds rate forecasts) for several future forecasts. The x-axis is the number of months out from the date being forecast. The striking feature of this graph is that the darker lines have shifted lower over time. This is more or less what I discussed in that previous post. However, when I looked back at the data (with the new forecasts add in) I noticed some anomalies and reweighed those results by the standard deviations of the payroll employment forecasts. 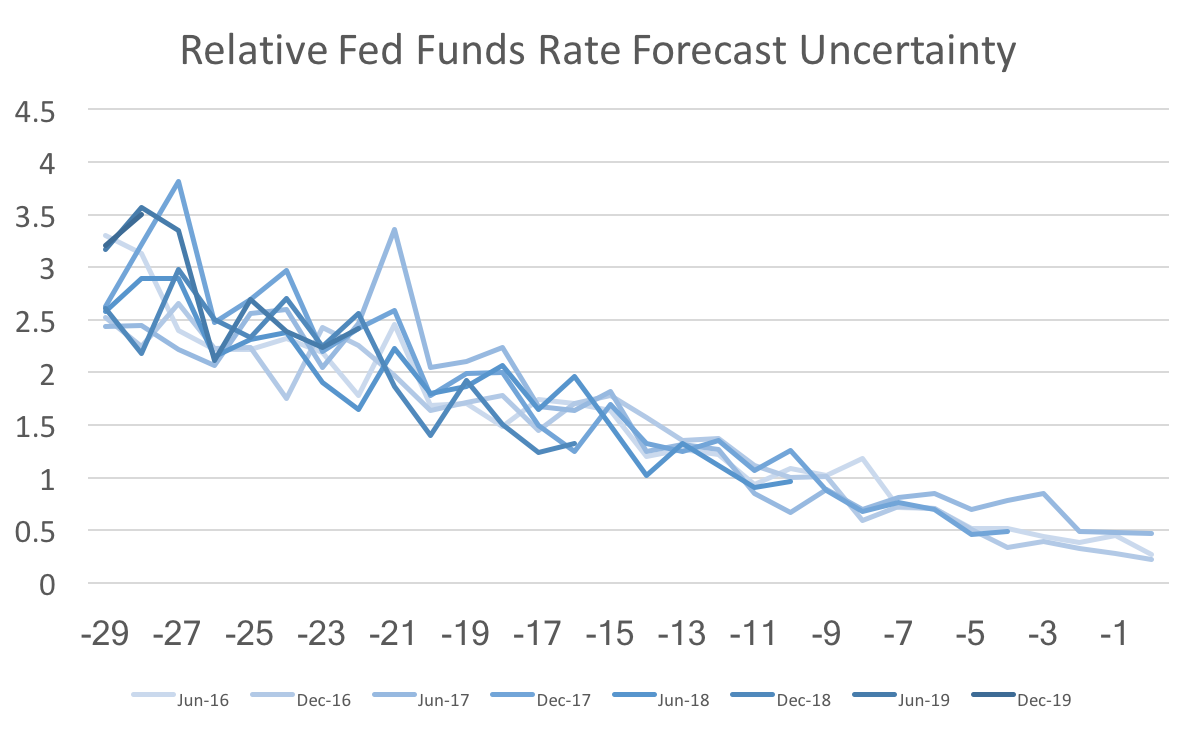 Once we recalculate federal funds rate uncertainty relative to the general level of uncertainty we find almost no change in fed funds rate uncertainty. If instead we calculate the same relative uncertainty for 10-year bonds, then we actually find that forecast uncertainty for 2019 is higher than normal: 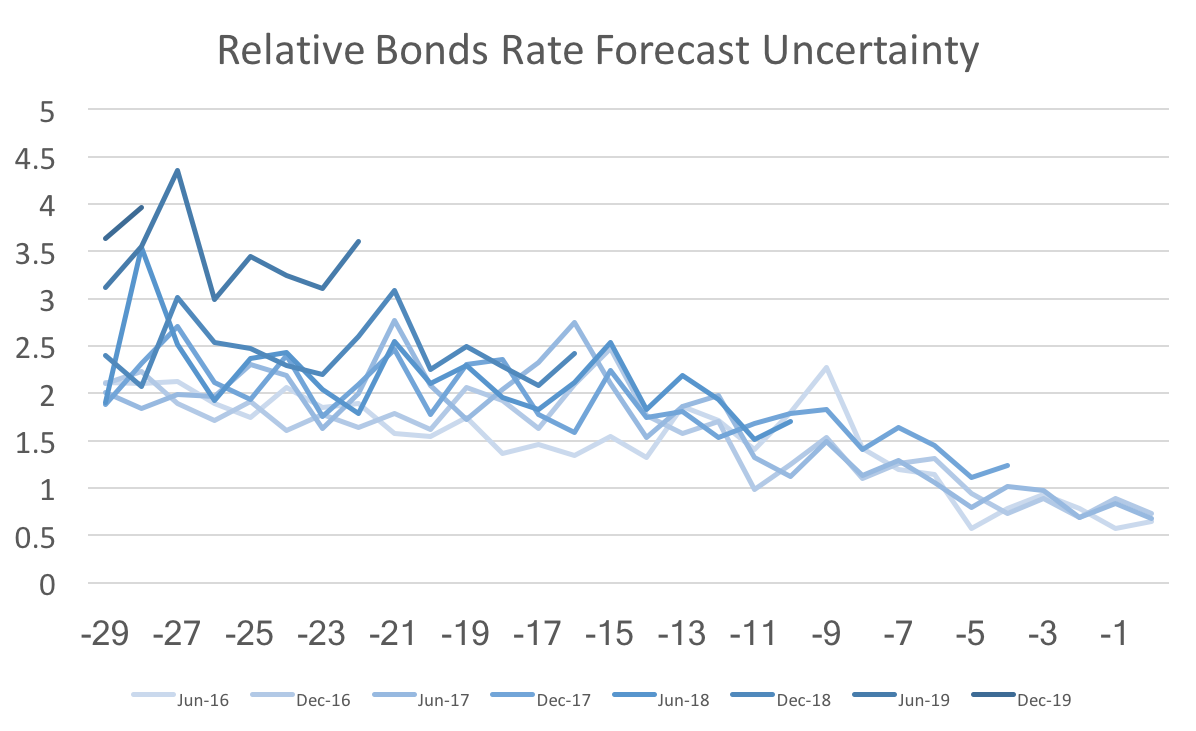 Since there has not been a dramatic shift in the more recent 2018 and 2017 forecasts, I suspect that the additional uncertainty is due to some forecasters projecting a recession (or at the very least a slow growth economy) while others foresee a continuing economic boom. To further support that claim we can see a similar pattern in quarterly GDP forecast uncertainty: 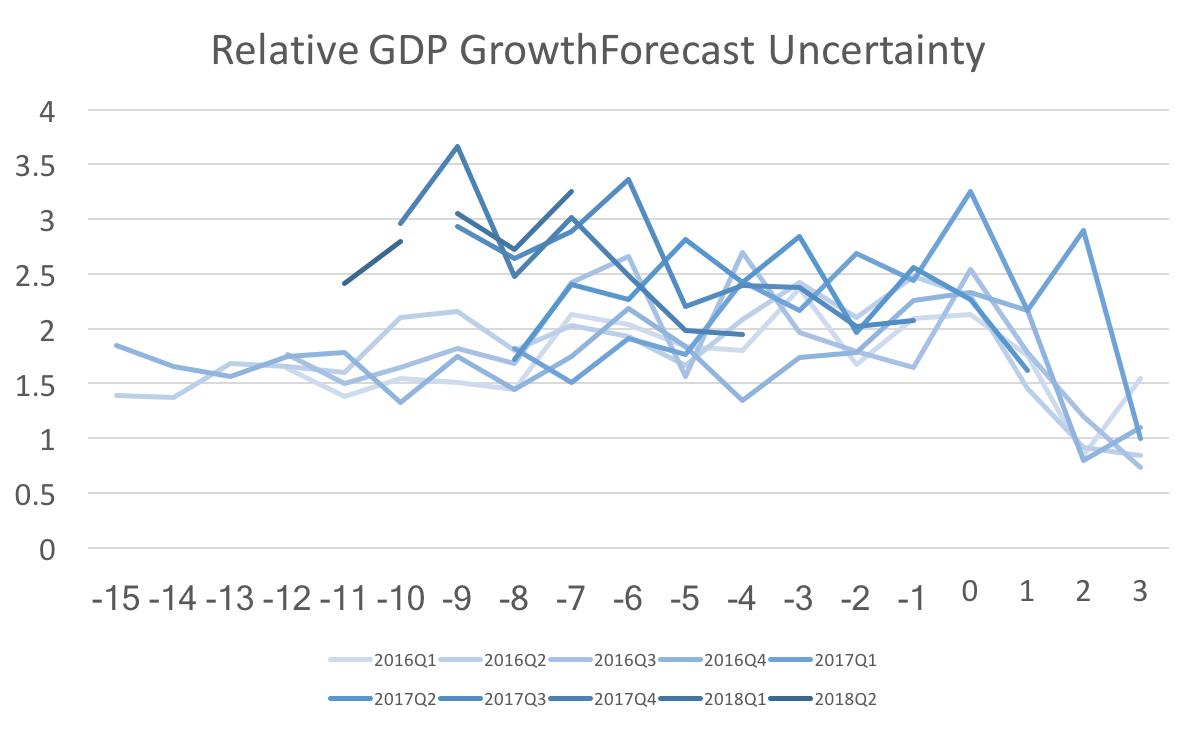 The forecast uncertainty of the Federal Funds Rate has remained similar to the past, relative to payrolls uncertainty. However, other variables appear to be getting more uncertain relative to payrolls uncertainty. For those facts to line up forecasters must understand and believe the Fed's announced policy trajectory.
0 Comments
Leave a Reply. |
Archives
May 2018
Categories
All
|