
 RSS Feed
|
About a month ago I produced my first forecasts of the US economy. This posts updates those forecasts given the new data available. The time-series model has several novel components. The most important of these components is aggregated expectations. Using expectations data from several sources I construct a new measure of expectations for real gdp, inflation and the federal funds rate. Instead of using the expectations directly (treating them as exogenous) I instead treat them as endogenous variables that are concurrently forecast with the VAR model. That is, I am forecasting the forecasts. Another novel component of my forecasts are constructed variables that measure the cycles within various "sectors" of the economy. In addition, to the four sectors in my previous forecasts (manufacturing, labor market, housing market, and financial market), I have also included an international sector. This might be an important addition given the recent discussions about tariffs and potential trade wars. The first step in the process creates cycles for each of the data series in each sector. Then, using dynamic factor analysis, I extract the common factor (or two) for each sector and use those in my forecasting model. The following three graphs display the quarterly forecasts of real GDP, CPI Inflation, and the unemployment rate. Below I dive into some detail to show the importance of expectations and the sectors in this forecasting model. 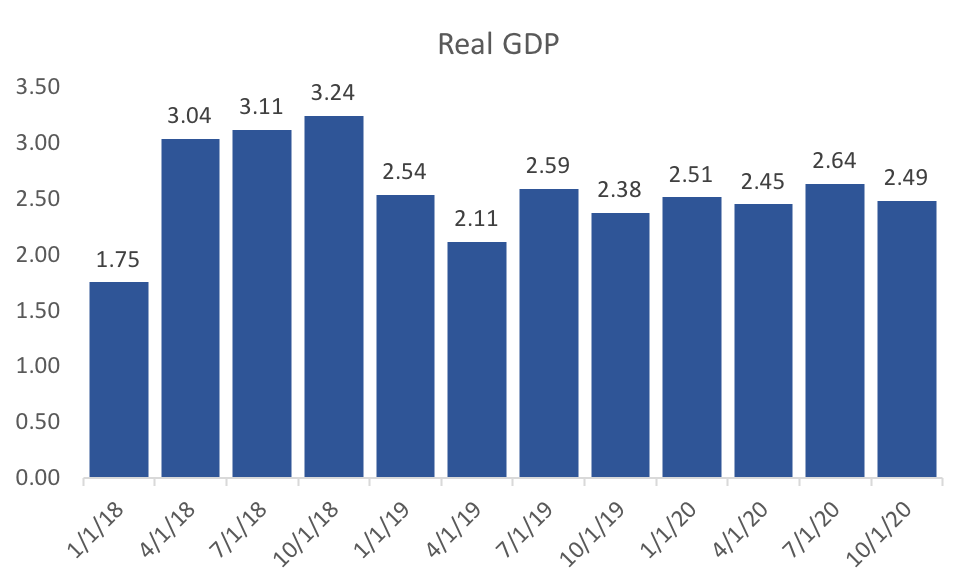 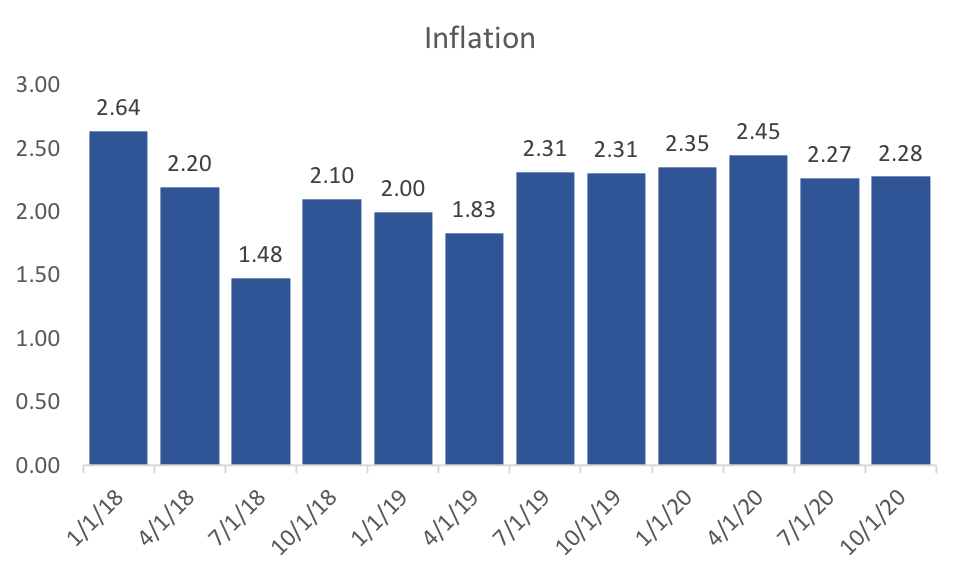 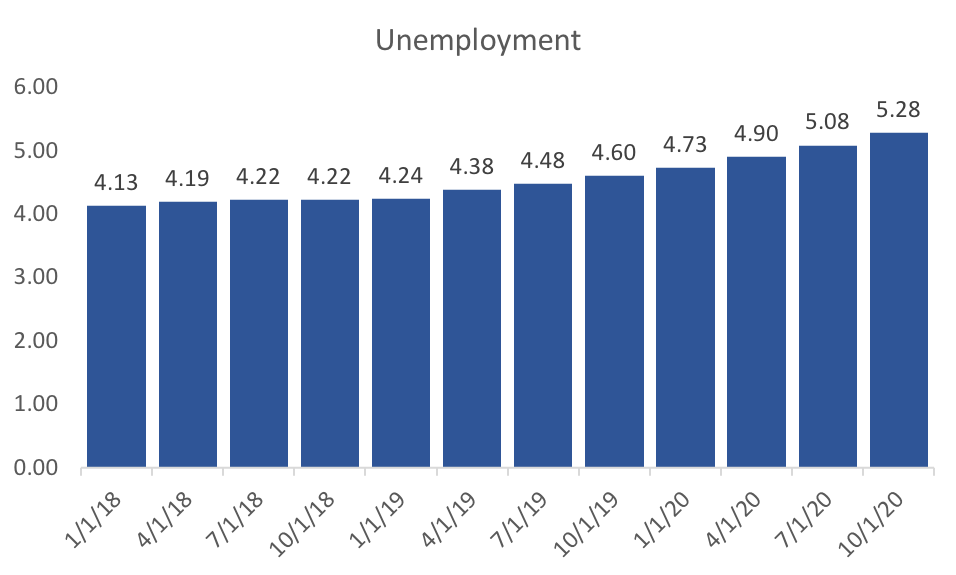 Unemployment change significantly since last month indicating that we are currently in the trough and that unemployment will remain more or less stable until mid 2019. Inflation is expected to be quite high in the first quarter, but drops of pretty dramatically to the Fed's 2 percent target. Real GDP projections for the first quarter of 2018 dropped off quite a bit since last month. In addition, the forecast for unemployment is very pessimistic. One might think that these changes are likely because of the recent jobs report. An alternative hypothesis is that it reflects the changes of the real GDP expectations variable (see my analysis of the April WSJ Forecasts). Below I test those hypotheses: 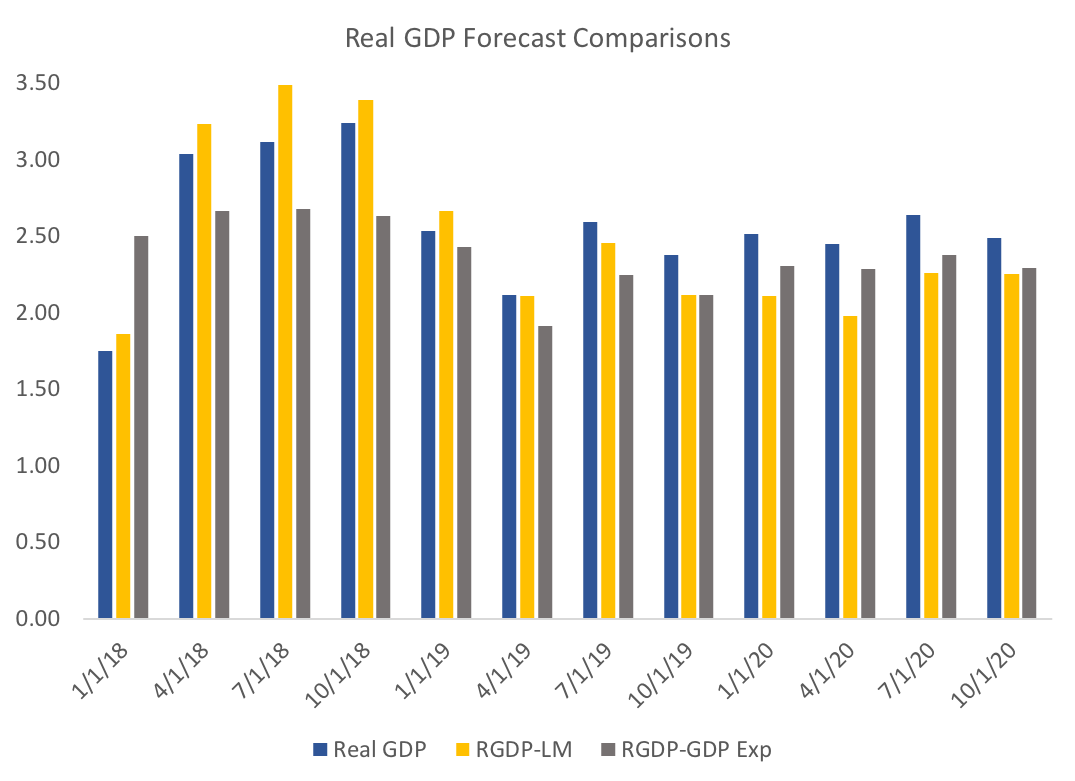 It seems as though the model with out the labor market data would still have more or less the same result in terms of GDP forecasts. However removing GDP expectations data had a huge impact on Q1 forecast of GDP. Recall that the model does not use the expectations data directly, but instead treats them as endogenous variables that can help explain GDP and other variables. 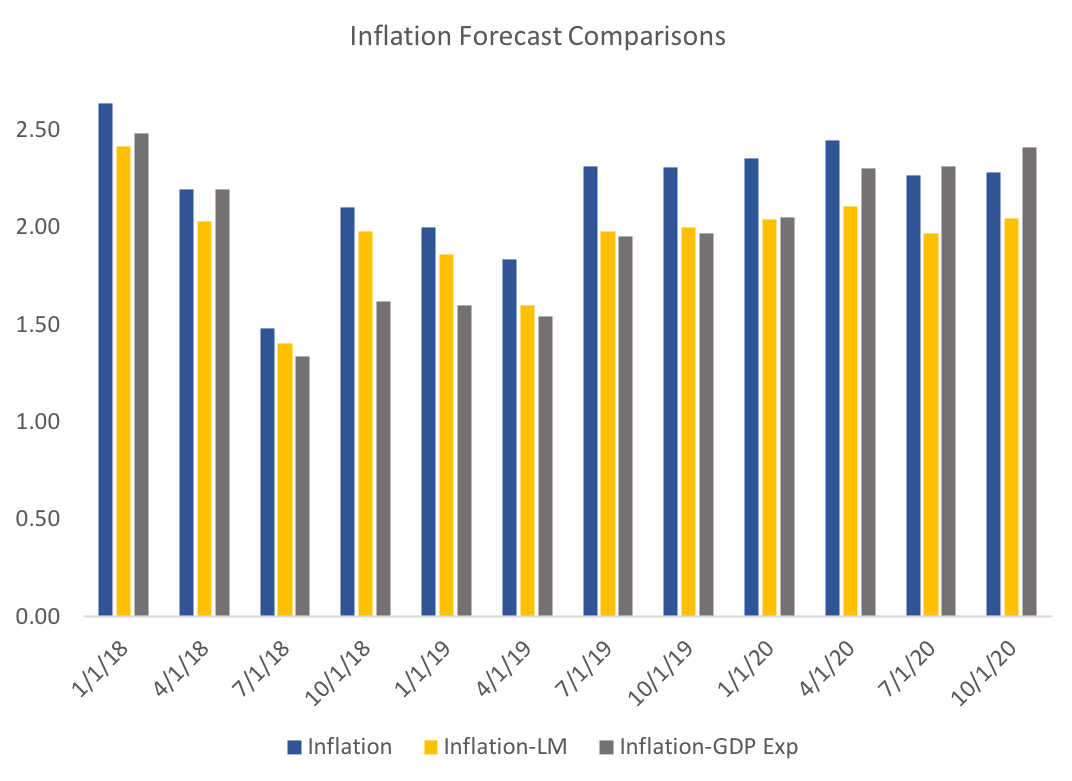 Turning to inflation, there is less of a difference between the models in the short run, however, in the long run the lack of labor market data suggest inflation rates closer to the Fed's target. 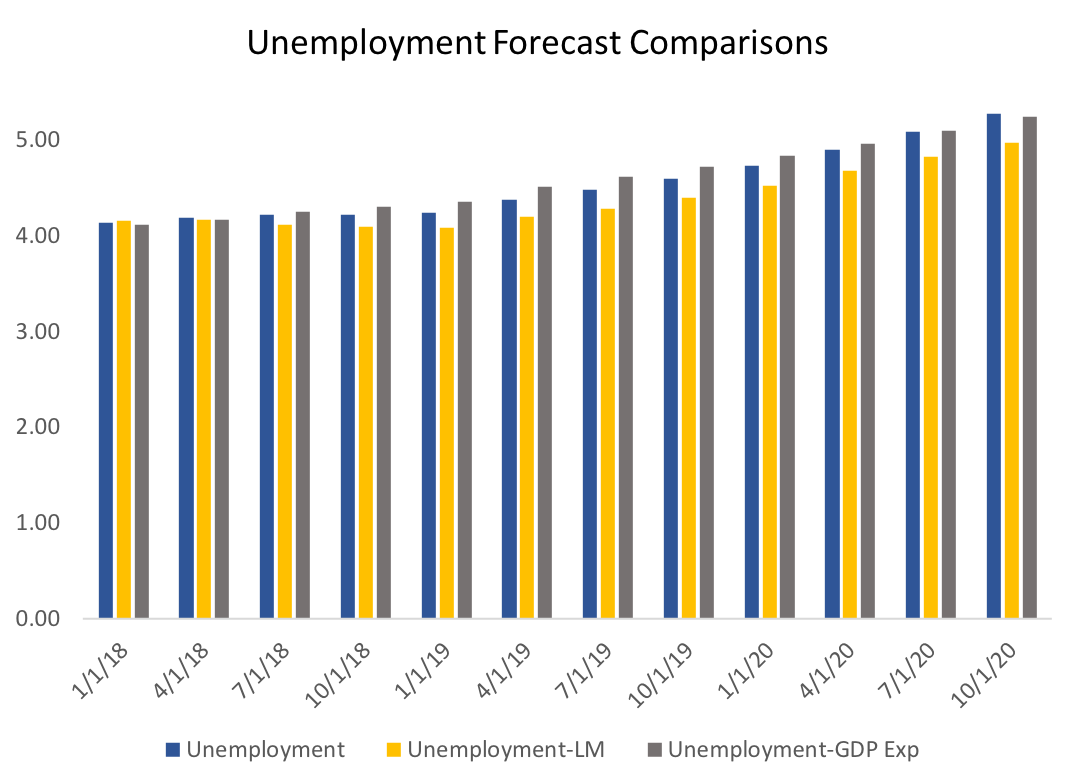 Finally, what I find the most interesting graph, though the most subtle. It seems that the recent labor market data has a strong impact on the dynamic in the unemployment rate. Without the labor market data we see a trough occurring in mid 2019. This suggests that, while the jobs report doesn't have a large impact on GDP, it should change our expectations about unemployment. In addition, expected GDP appears to have a dramatic impact on short-run forecasts of GDP.
1 Comment
The WSJ Forecasts are out for April and we can observe forecasts staying steady with a few exceptions. Most notably 2018Q1 GDP forecasts fell by almost one half a percent over the last month: 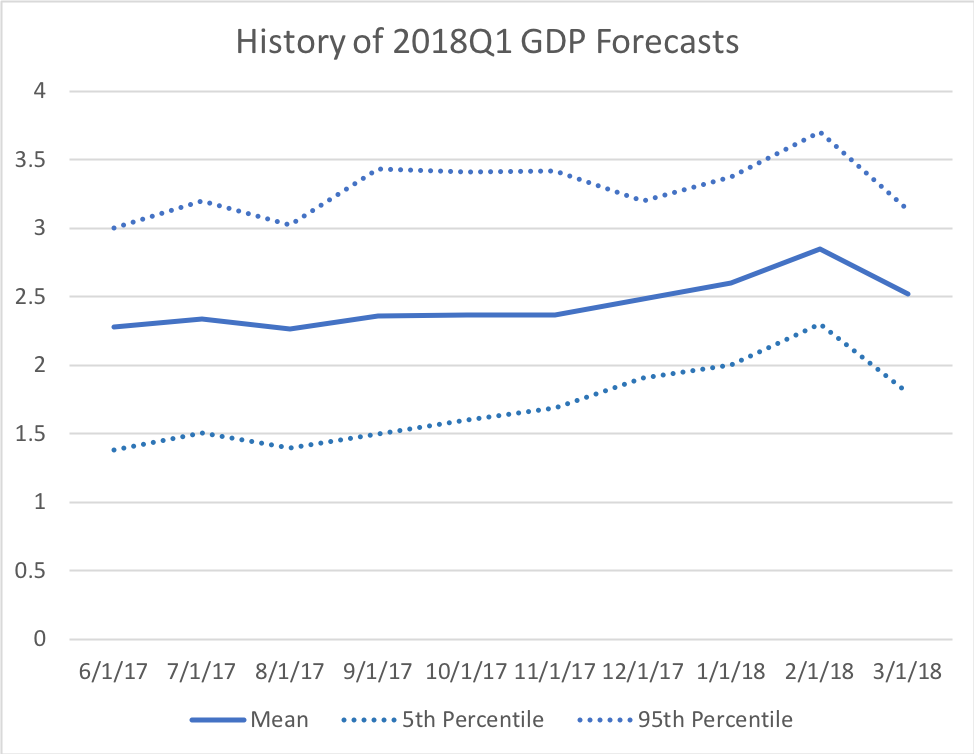 While one might immediately think the recent jobs report might have something to do with it, I suspect this is not the case. First, while the reported number was quite low and January and February revisions combined to 50,000 fewer jobs over those months, the 3 month average for Q1 was still about 200,000. Second, the other forecast of GDP growth were more or less unchanged, signaling that, according to the consensus forecasts, underlying fundamentals have not changed much. While the expectation is still for robust growth in the first quarter the reversal in the trend of expectations is a bit surprising.
Despite a bit of a reversal in Q1 GDP growth, most other indicators have remained consistent with pst forecasts. If anything long run unemployment expectations grew stronger with the end of 2020 expectations dropping a tenth of a percent. This makes the consensus forecast of unemployment for the coming two years less than 4 percent. Inflation expectations over all horizons rose moderately, and the recent Federal Reserve policy actions and statements have just confirmed our professional forecasts. The only signs of major changes came in crude oil prices expectations, which jumped by a dollar or more after 2018. In addition the recession probability forecast rose 1.67 percent to a little over 15 percent. All in all, the recent data has not moved forecasts drastically. |
Archives
May 2018
Categories
All
|