
 RSS Feed
|
There is a lot of talk about bubbles in the stock market. Robert Shiller used to think there was a bubble, and continues to believe the market correction is coming soon. Paul Krugman is less sanguine, attributing the stock market boom to a global phenomenon and foreseeing economic strength in the future. Given his exhaustive analysis of the Great Recession and the aftermath, I would not expect him to miss an opportunity to warn about another bubble bursting. I more or less agree with Krugman, and I think market participants agree too. Take a look at the dramatic increase in margin debt relative to credit balances in margin accounts in the NYSE: 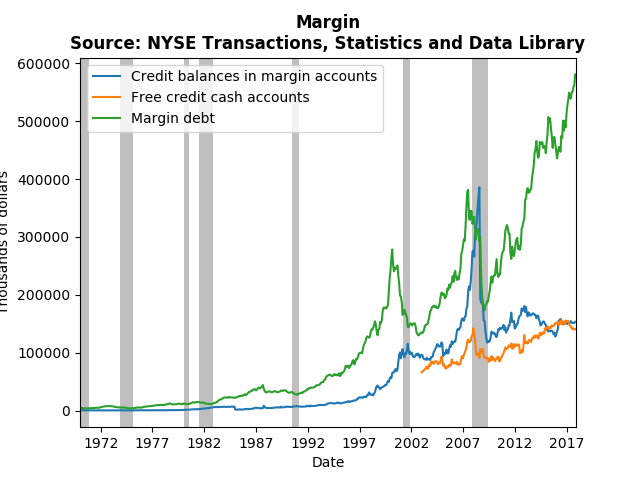 Clearly, the greatest risk takers (those trading on margins) are holding lots of long positions, while keeping short positions more or less constant. There has been a build up of credit in cash accounts, but it seems to be following the general upward trends of stock market participation. What I would be interested to know is whether the additional margin debt is due to new participants trading, or seasoned participants foreseeing long-term growth. If it is new participants, then there almost surely is a bubble. However, seasoned professionals would presumably be taking more short positions if the expected a coming crash. Should global stocks tank in the near future, it should be a big surprise.
1 Comment
The third type of post on this blog will consist of interesting data and/or empirical techniques. The world has become increasingly dependent on data and data analysis. Understanding what one can do with data and recognizing the vast array of potential data can improve both personal and professional decsion making. This particular post will highlight both an interesting data set, NYSE trade volume, and an emprical technique, a method proposed by James Hamilton for extracting cycles from time-series data. The New York Stock Exchange has a wonderful website that provides NYSE Group Daily Share volume all the way back to 1888! While this might not provide deep insight to a particular stock or industry, it does provide an overview of the general investment climate. The graph below displays the logarithm of trade volume, with NBER dated recessions in grey for reference. Even in logarithms, the growth in trade volume over almost 140 years is tremendous. 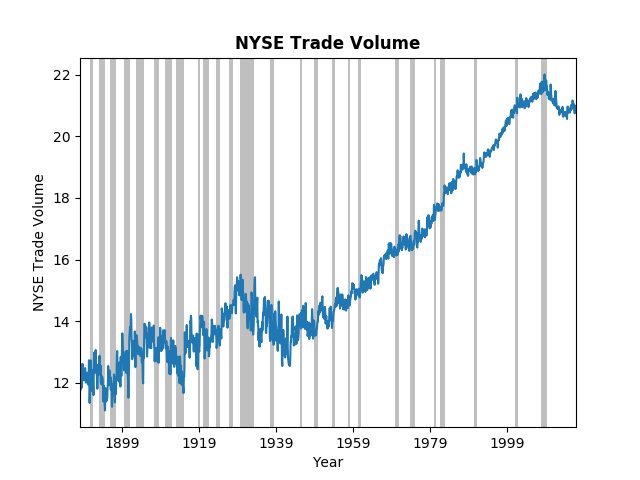 It is clear from the figure that financial crisis had significant impact on overall trade volume. However, we might ask, Is this worse than previous down turns? or Have we climbed out of the hole yet? To answer those questions we turn to a paper/post from James Hamilton on the Hodrick-Prescott (HP) filter. Dr. Hamilton does a great job of explaining the HP filter, why you should not use it, and his proposed alternative. The graph below uses his alternative to extract the cycles from the trade volume data. 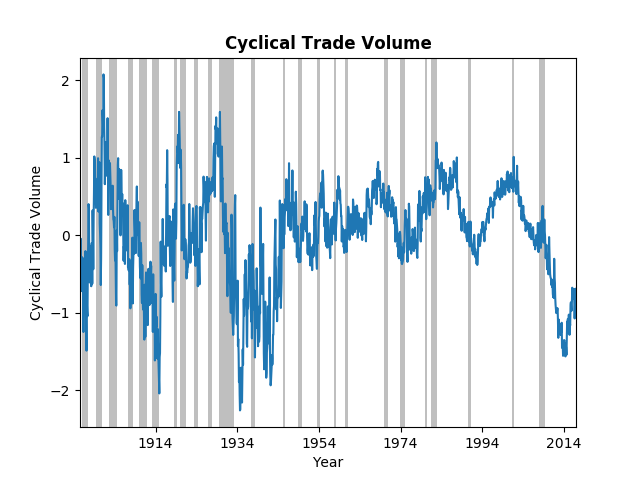 Not surprisingly the most recent down-turn was dramatic, but on the same scale as the Great Depression and the after effects of the 1907 panic. For those of you interested in history, the Federal Reserve was created in response to the 1907 crash. It does appear that trade volume has begun to climb toward the long-run trend, but it still has a ways to go. One final note on this data; trade-volume has become more stable. The wild swings in the early 1900's have significantly decreased, in part, one might argue, due to the financial regulations put in place after the Great Depression.
|
Archives
May 2018
Categories
All
|