
 RSS Feed
|
Hillary Clinton stated in a recent interview that misogyny contributed to her loss in the 2016 election. No doubt that some voters cast votes based on gender (in both for and against Clinton), but those voters (and votes) decided long before the election season started. Many claim that Bernie Sanders and Donald Trump tapped into working class anger over inequality. However as Nate Silver has pointed out on numerous occasion (here and here just to mention a few), GDP growth has some explanatory power in predicting elections. Specifically, low or negative GDP growth tends to hurt the chances of the incumbent party. This post dissects the claims of inequality and headline economic growth. 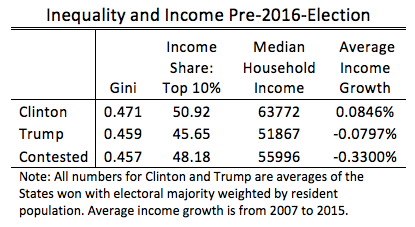 The table above provides statistics of states in which the majority of voters voted for Clinton or Trump and those states where neither received the majority. For inequality we have data on the Gini coefficient within each state in 2010 and the share of income commanded by the top 10 percent within each state in 2013. The Gini coefficient measures the degree of inequality on a scale from 0 (least unequal) to 1 (most unequal). Clearly by both measures, within-state inequality was worse for states that overwhelmingly voted for Clinton.
Hosehold median income arguably shows the inequality story as a national phenomenon, but those statistics were qualitatively the same at the time of Barack Obama's re-election in 2012. However, when we turn to the average growth rate of median household income over Obama's tenure (2007-2015) we see a striking disparity between the states where the majority voted for Clinton and the rest. The solid Clinton states fully recovered from the recession and have even surpassed pre-crisis income levels. In contrast, the solid Trump States have not. In the contested state, the "incumbent" democrats faced strong headwinds from the slow growing economy. What have we learned? Local inequality does not seem to be driving election results, however, the lack of economic recovery in states that either voted for Trump or were narrow contests surely influenced the election. A suggestion for future elections would be to consider the long-term economic growth within a state as opposed to the entire nation over the term of the incumbent. Notes: Gini data comes from the US Census Bureau. Income share data comes from Mark Frank. Household income data comes from the GeoFred database.
0 Comments
|
Archives
May 2018
Categories
All
|