RSS Feed
|
The new data and data revisions of the past month have generated positive changes in my US forecast model. While the model still predicts a drop off of real GDP growth through the end of 2020, the rest of 2018 and the beginning of 2019 reflect the short-term fiscal stimulus. The model implies that by the end of 2020 we will return to the long-run average of about 2 percent. It would by incorrect to assume that the long-run forecast implies that there will not be a recession in 2020, since the model is not designed for long-run recession forecasting. 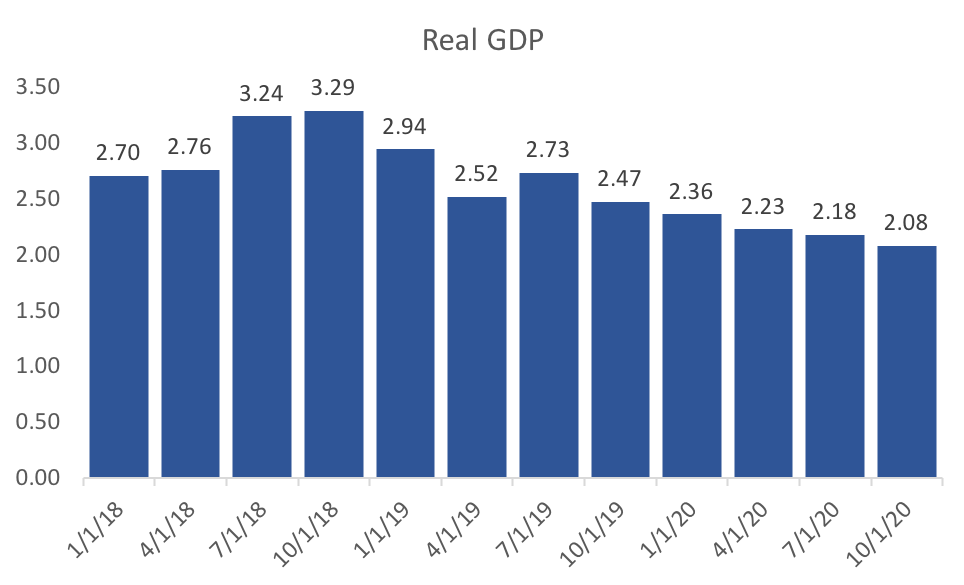 The recent increase in the federal funds rate has had a marked impact on the models inflation forecast, with inflation slowing through the end of 2019. This is, of course, the objective of monetary policy makers, and I suspect that the model is being overly pessimistic about Q3 2018. 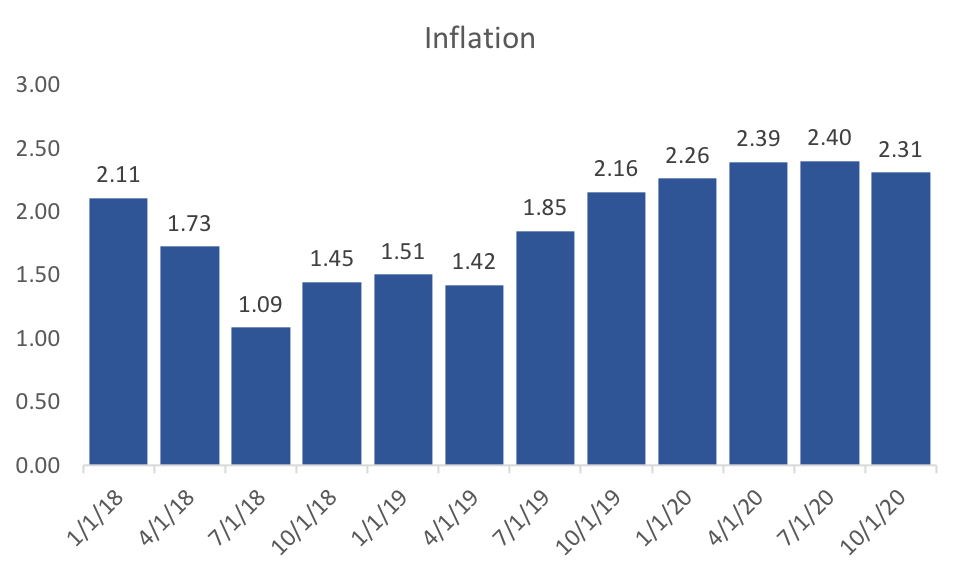 The models unemployment forecasts are starting to fall more in line with recent data releases. The trough of unemployment is still predicted in early 2019, with accelerating increases in unemployment through 2020. This could signal the potential for a recession by the end of 2020, and certainly would suggest that an economic head-wind or two could set off a recession in 2020. 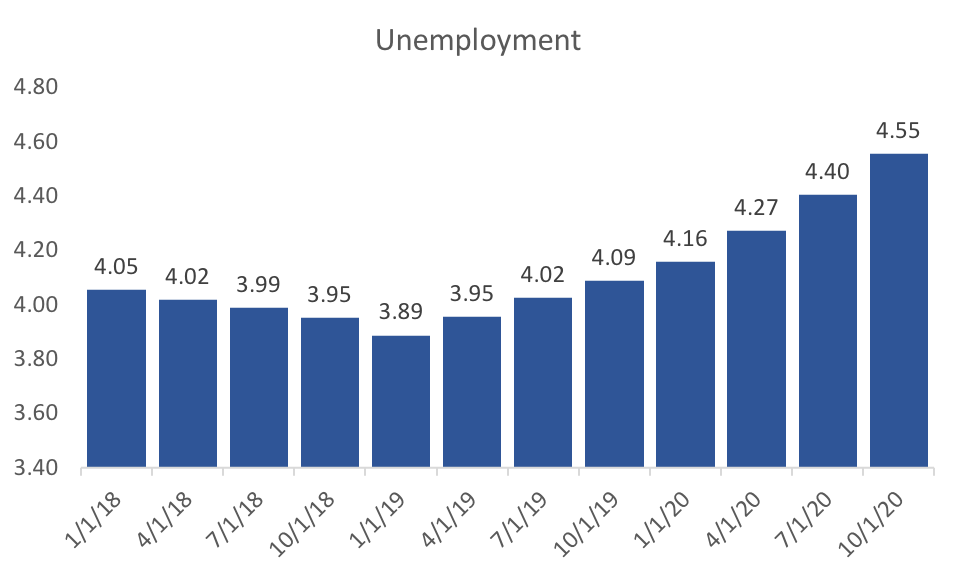 Just as I did in the previous month's forecast, I provide my aggregated expectations of inflation, real GDP growth, and the federal funds rate below.
0 Comments
Using the most recent data including updated aggregate expectations, I have a new set of headline forecasts. First quarter data on international trade and finance have yet to be released, so these forecasts still rely on estimates of the Q1. Second quarter real GDP has dropped significantly (almost half a percent) from last month, whereas first-quarter forecasts increased to fall in line with the advance estimate. The end of 2018 still looks to be quite strong, before mellowing to long-run average growth in 2020. 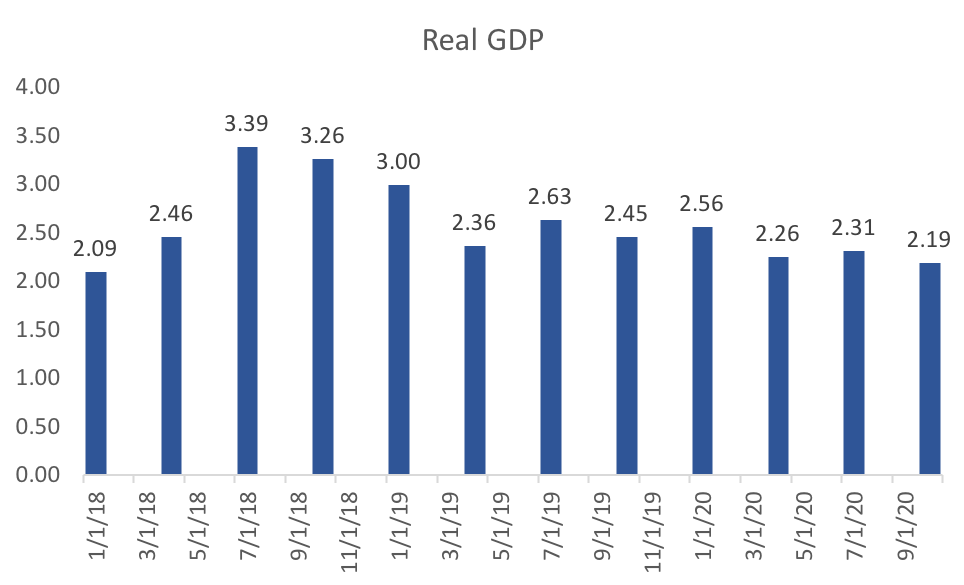 Despite an apparent level shift (the newest unemployment data suggests my Q1 forecast is too high by 0.2 percentage points), my unemployment forecasts see further declines into 2019 before steadily climbing in 2020. That acceleration in unemployment is consistent with a significant recession beginning in the third or fourth quarter of 2020. 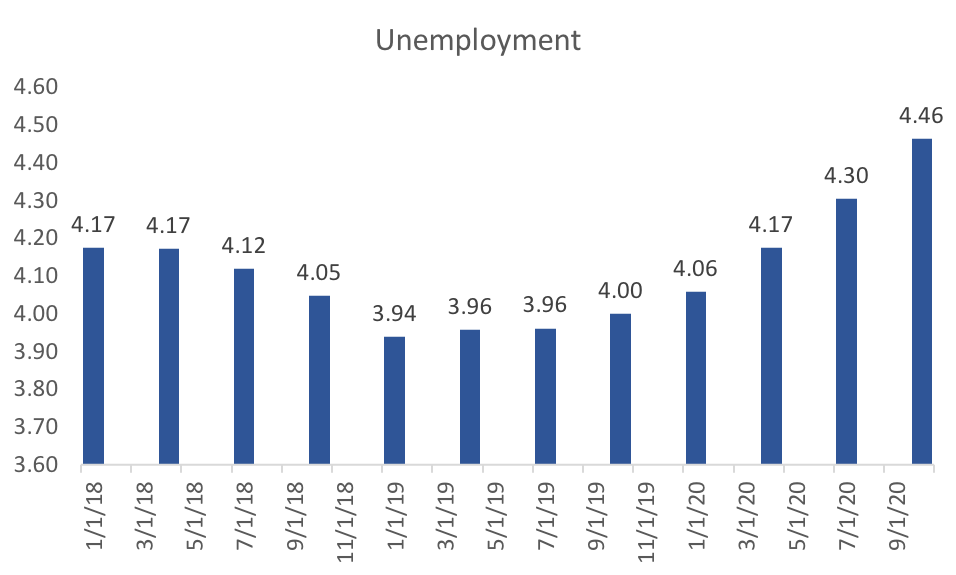 My model's forecasts of inflation suggest that the Fed's projected rate increases will keep inflation in check through 2019. There is a lot less variability in this set of projections compared to last month. The decline in inflation through 2018 seems robust, as does its eventual rise in 2020. 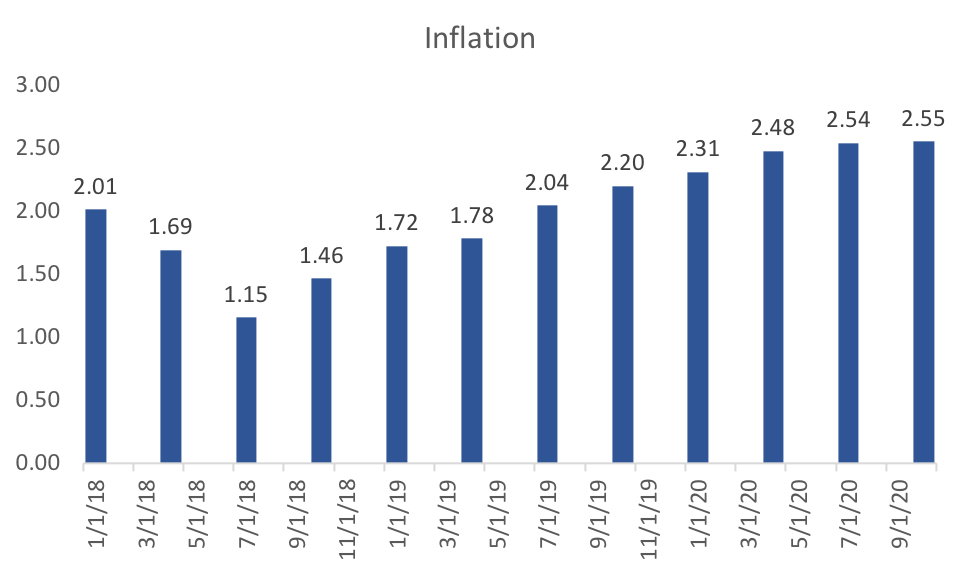 To round off this months forecast, I include the aggregate estimates of Inflation, GDP, and the federal funds rate. Inflation and GDP expectations remain high despite a (well-founded) belief of a rising federal funds rate. Another relatively quiet month in terms of economic news. The recent data has not done much to shift the views of forecasters very significantly. One of the special questions in this months survey was regarding the timing of the next recession. Ben Leubsdorf of the WSJ does a great job discussing those responses. The big movers this month are crude oil price expectations, which jumped 5.5 dollars for June 2018, and the yield curve spread, which narrowed some more. Oil prices through the end of 2020 are expected to rise but with diminishing amounts, with December 2020 forecasts only rising 1.9 dollars. The yield curve spread is actually quite fascinating as I have noted in past reports. 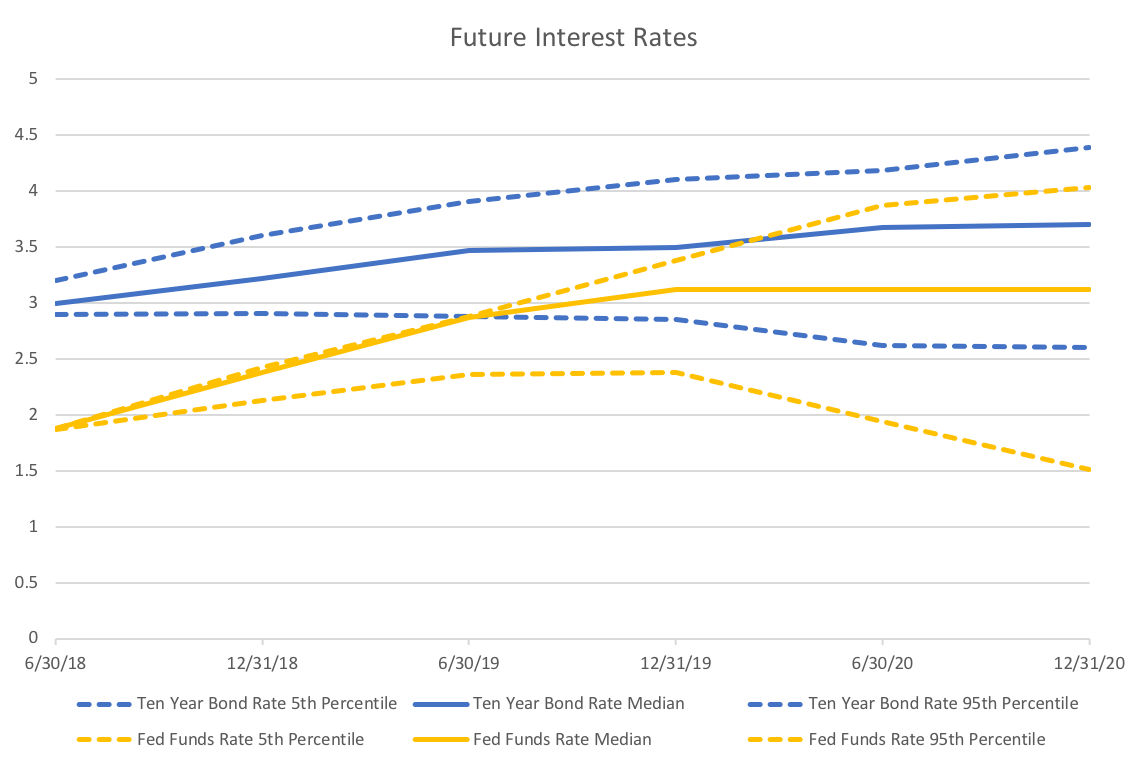 The graph above shows the yield curve tightening through 2020. More importantly, the variability of these forecasts is interesting as well. The difference between the 5th and 95th percentiles grows dramatically for the fed funds rate but is much more stable for the ten-year bond rates. It is unclear whether it is policy uncertainty or economic uncertainty that is driving this difference. However, it is strange that forecasters predict that the long rate will not respond, at least not one for one, to the stated Fed goal of raising rates at least two more time by the end of the year.
Another curiosity: even though the majority of forecasters expect a recession in 2020, they don't seem to think that the Fed will respond to it. If they did I would expect the median fed forecast to at least be fall from June 2020 to December 2020. However, the recession timing predictions are more or less consistent with the consensus unemployment forecasts hitting their low in mid to late 2019. About a month ago I produced my first forecasts of the US economy. This posts updates those forecasts given the new data available. The time-series model has several novel components. The most important of these components is aggregated expectations. Using expectations data from several sources I construct a new measure of expectations for real gdp, inflation and the federal funds rate. Instead of using the expectations directly (treating them as exogenous) I instead treat them as endogenous variables that are concurrently forecast with the VAR model. That is, I am forecasting the forecasts. Another novel component of my forecasts are constructed variables that measure the cycles within various "sectors" of the economy. In addition, to the four sectors in my previous forecasts (manufacturing, labor market, housing market, and financial market), I have also included an international sector. This might be an important addition given the recent discussions about tariffs and potential trade wars. The first step in the process creates cycles for each of the data series in each sector. Then, using dynamic factor analysis, I extract the common factor (or two) for each sector and use those in my forecasting model. The following three graphs display the quarterly forecasts of real GDP, CPI Inflation, and the unemployment rate. Below I dive into some detail to show the importance of expectations and the sectors in this forecasting model. 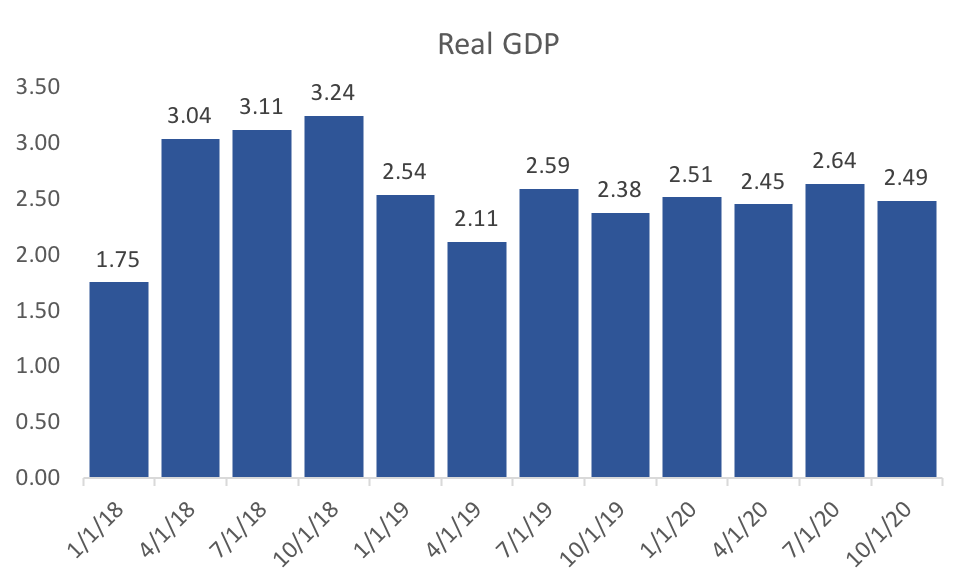 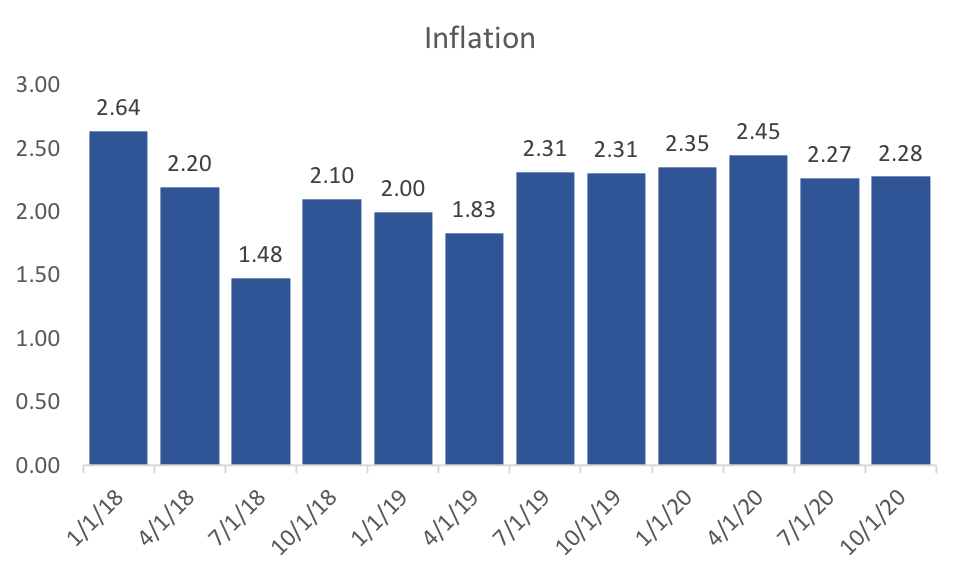 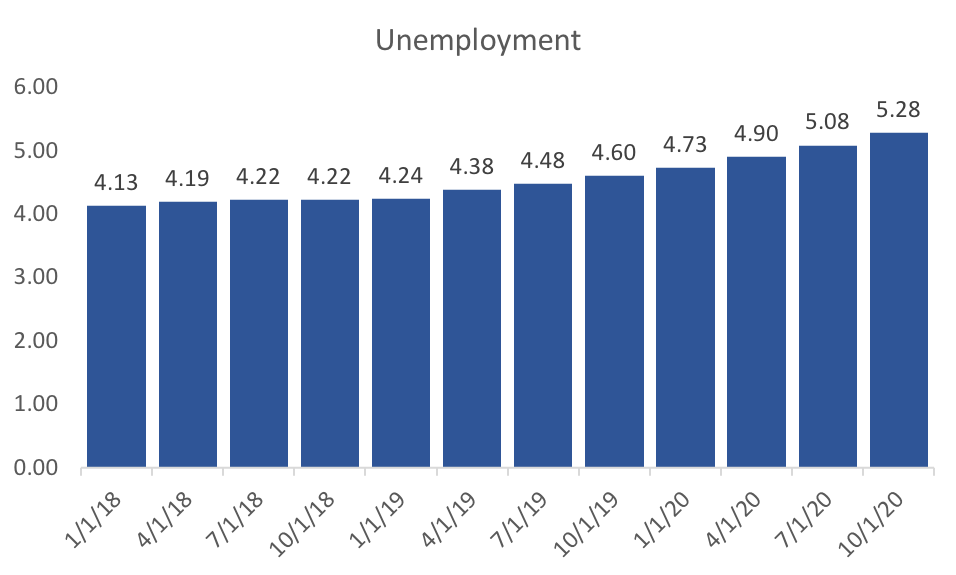 Unemployment change significantly since last month indicating that we are currently in the trough and that unemployment will remain more or less stable until mid 2019. Inflation is expected to be quite high in the first quarter, but drops of pretty dramatically to the Fed's 2 percent target. Real GDP projections for the first quarter of 2018 dropped off quite a bit since last month. In addition, the forecast for unemployment is very pessimistic. One might think that these changes are likely because of the recent jobs report. An alternative hypothesis is that it reflects the changes of the real GDP expectations variable (see my analysis of the April WSJ Forecasts). Below I test those hypotheses: 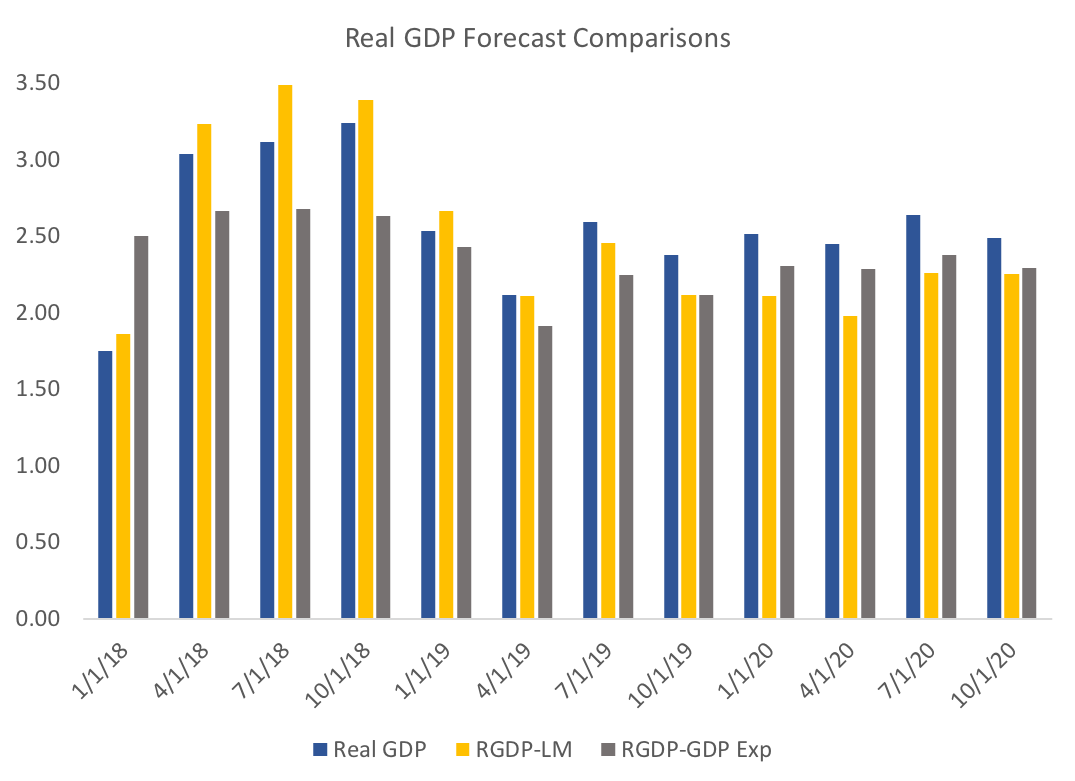 It seems as though the model with out the labor market data would still have more or less the same result in terms of GDP forecasts. However removing GDP expectations data had a huge impact on Q1 forecast of GDP. Recall that the model does not use the expectations data directly, but instead treats them as endogenous variables that can help explain GDP and other variables. 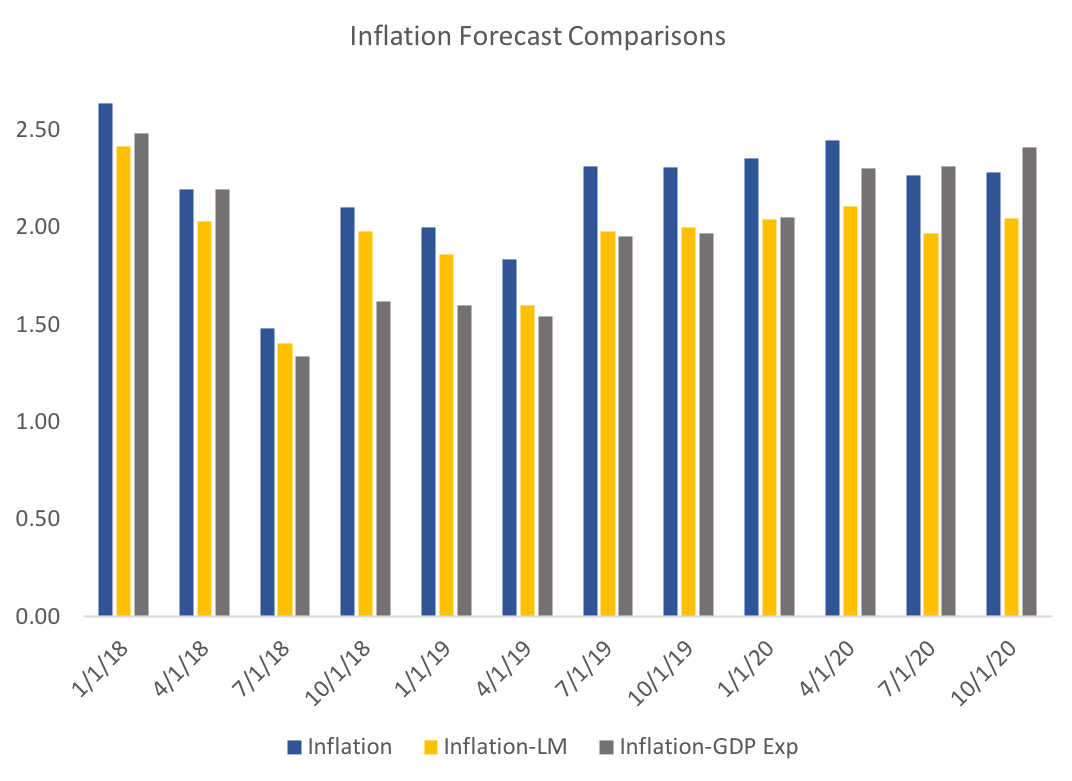 Turning to inflation, there is less of a difference between the models in the short run, however, in the long run the lack of labor market data suggest inflation rates closer to the Fed's target. 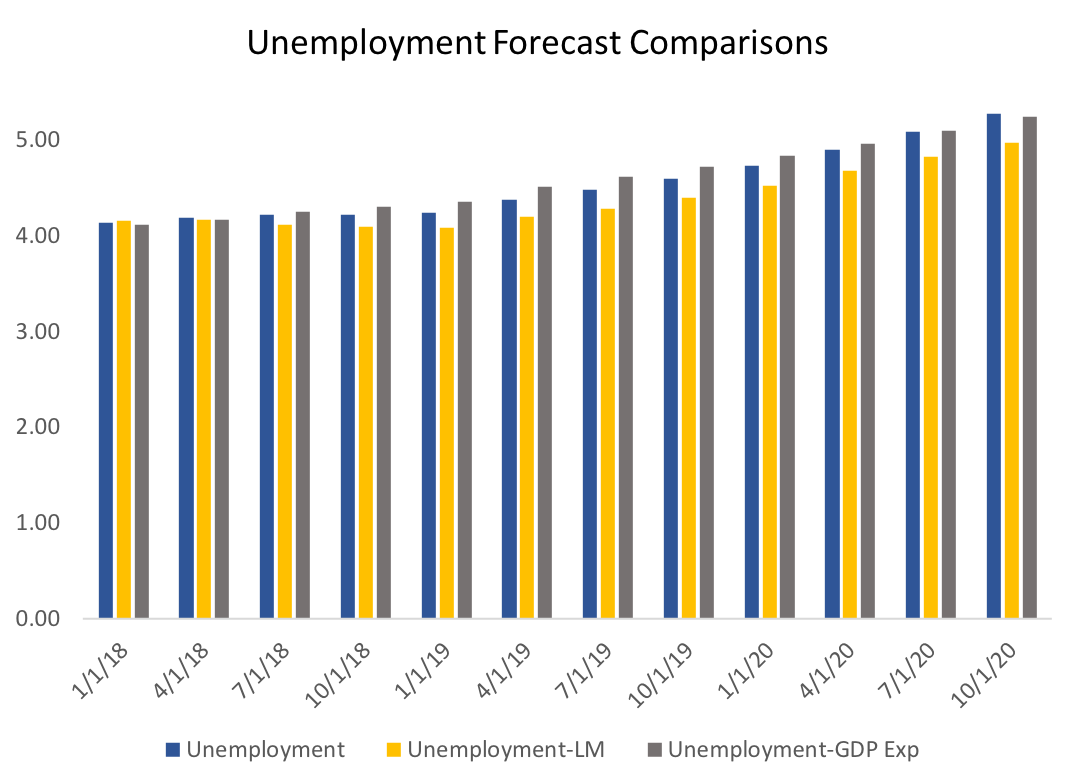 Finally, what I find the most interesting graph, though the most subtle. It seems that the recent labor market data has a strong impact on the dynamic in the unemployment rate. Without the labor market data we see a trough occurring in mid 2019. This suggests that, while the jobs report doesn't have a large impact on GDP, it should change our expectations about unemployment. In addition, expected GDP appears to have a dramatic impact on short-run forecasts of GDP.
The WSJ Forecasts are out for April and we can observe forecasts staying steady with a few exceptions. Most notably 2018Q1 GDP forecasts fell by almost one half a percent over the last month: 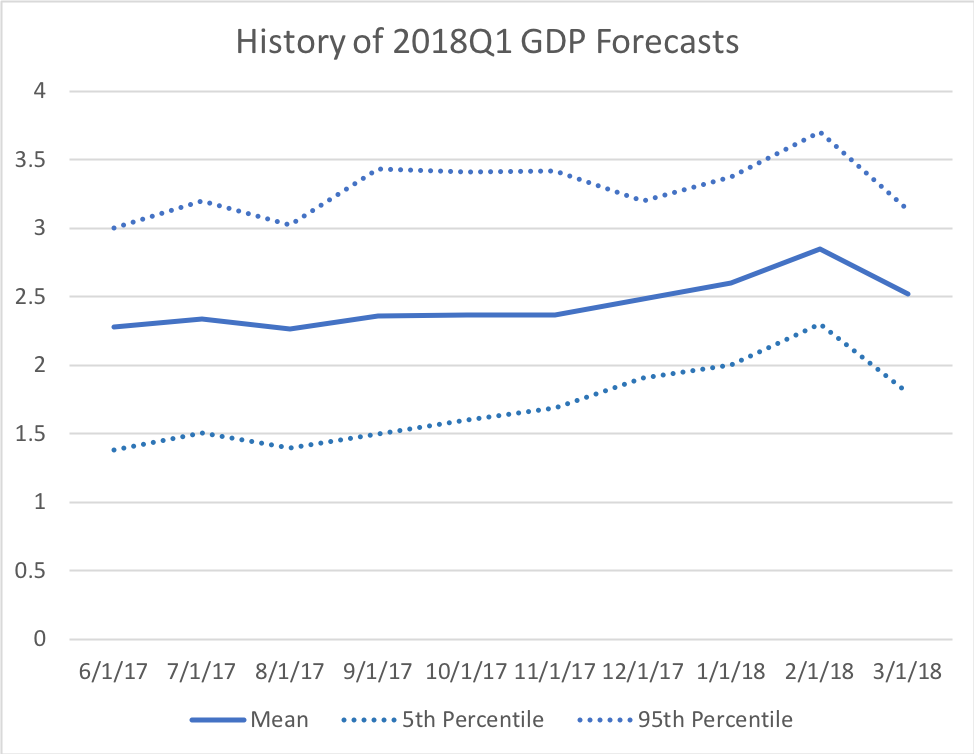 While one might immediately think the recent jobs report might have something to do with it, I suspect this is not the case. First, while the reported number was quite low and January and February revisions combined to 50,000 fewer jobs over those months, the 3 month average for Q1 was still about 200,000. Second, the other forecast of GDP growth were more or less unchanged, signaling that, according to the consensus forecasts, underlying fundamentals have not changed much. While the expectation is still for robust growth in the first quarter the reversal in the trend of expectations is a bit surprising.
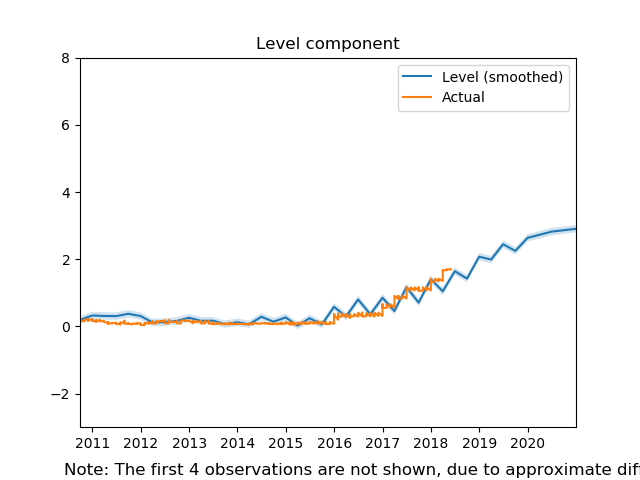
Despite a bit of a reversal in Q1 GDP growth, most other indicators have remained consistent with pst forecasts. If anything long run unemployment expectations grew stronger with the end of 2020 expectations dropping a tenth of a percent. This makes the consensus forecast of unemployment for the coming two years less than 4 percent. Inflation expectations over all horizons rose moderately, and the recent Federal Reserve policy actions and statements have just confirmed our professional forecasts. The only signs of major changes came in crude oil prices expectations, which jumped by a dollar or more after 2018. In addition the recession probability forecast rose 1.67 percent to a little over 15 percent. All in all, the recent data has not moved forecasts drastically. Many of my posts have focused on the WSJ economic forecasting survey. However, I have decided to include my own projections of the US economy. For now I will focus on headline economic data, namely Real GDP, Inflation, and Unemployment, but I plan to add more macroeconomic indicators as I develop more models. The unique aspect of my forecasting methodology is grouping some data series into few sectors (financial, manufacturing, housing, and labor) and including the aggregate measures of expectations I have previously discussed. Please see those previous posts for the methodology behind the aggregate expectations. The sector data uses the cyclical components of several data series within a sector. For example, in the labor market sector I use payroll employment, initial claims, weekly hours, and mean unemployment duration. After generating those cycles I feed them through a dynamic factor model and extract a latent factor series, which I consider markers of broader cycle within the sector. The graph below shows those latent factors: 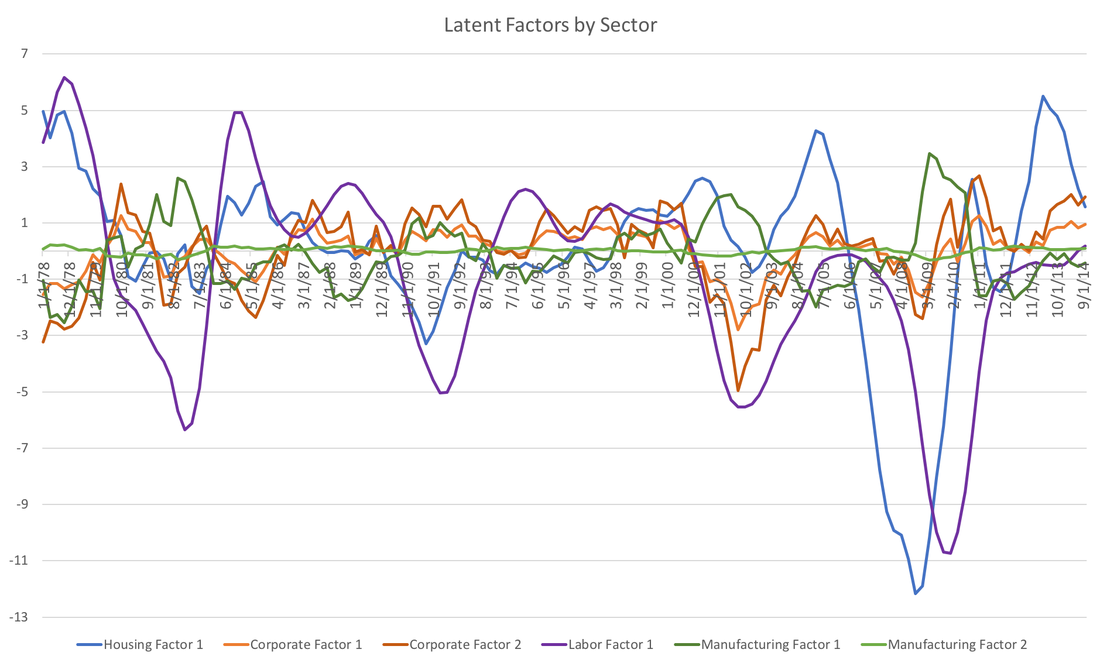 Combining those latent factors of those four sectors with aggregated expectations of inflation, real GDP, and the Federal Funds Rate, we run VARMA(4,0) and forecast 12 quarters out. The bar graph below presents the results for real GDP: 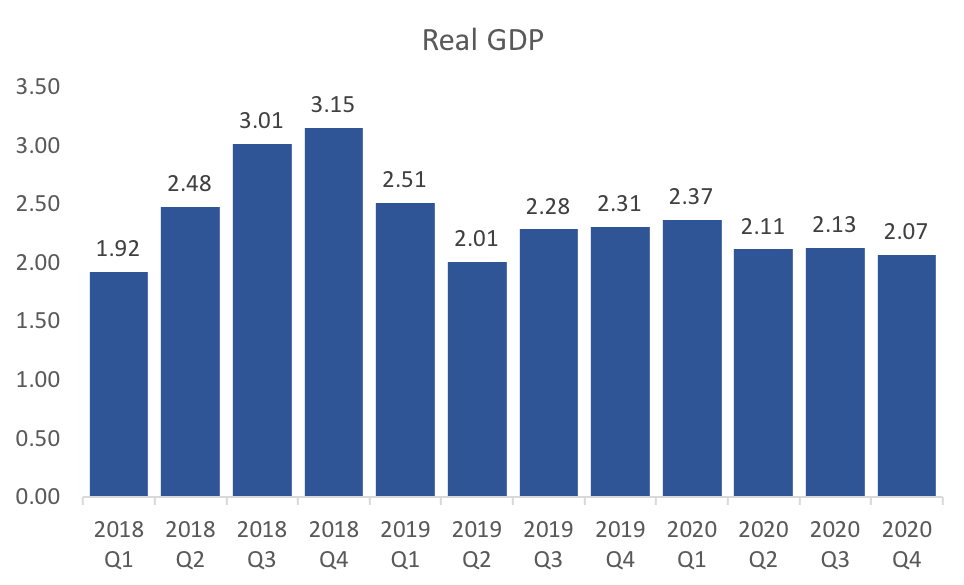 The model is optimistic about the second half of 2018. On the whole 2018 looks to be a quite robust year with 2019 showing signs of returning to the average long run growth rate. 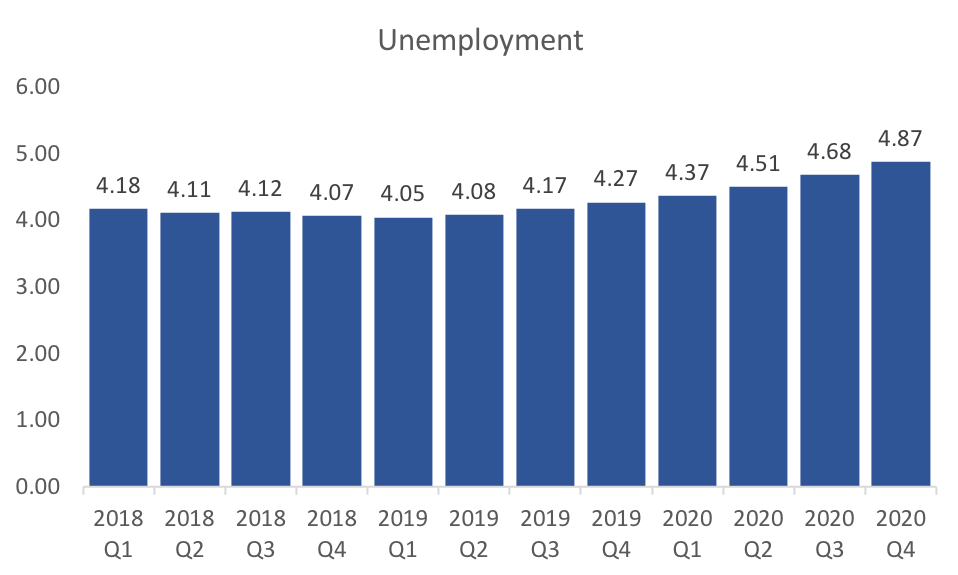 Turning to unemployment, the model is off a little on the level of unemployment, but I suspect that the dynamics are more or less a good prediction. The trough in unemployment is expected fro the first quarter of 2019. This is a little earlier than the WSJ consensus, but It also seems in line with the slow down predicted in GDP. 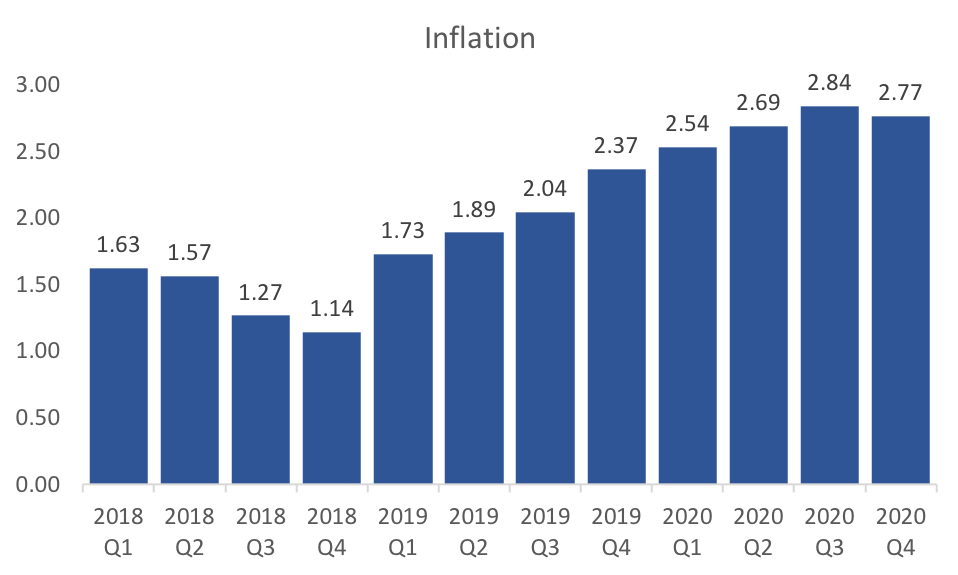 The forecasts for inflation are a little more surprising. The model predicts low inflation (relative to the Fed's target of 2%) for 2018. If I remove the federal funds rate expectations from the professional forecasters then this drop off in 2018 disappears. Therefore, the impact seem all related to the planned monetary tightening by the Fed.
I plan to make many improvements to this forecasting model, but would be interested in your thoughts... Time again to visit WSJ Economic Forecasts. There was a great jobs report last week and other economic data seem to support a strong medium-run economy in the views of the professional forecasters. The only major downside was a sharp decrease in the forecast of first quarter GDP in 2018 which dropped by a third of a percent to 2.52 percent.
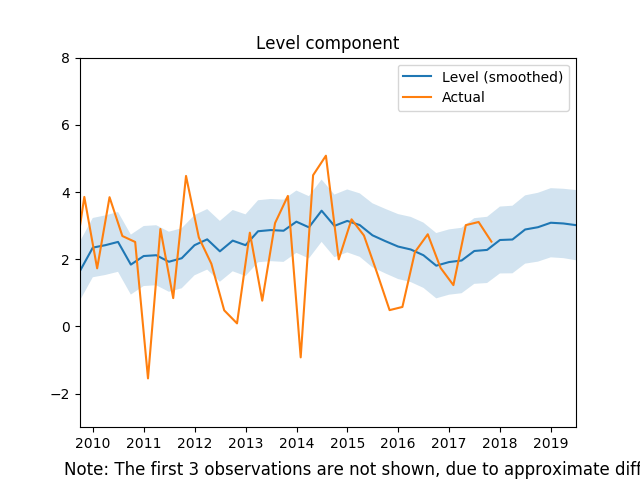
The unemployment rate, which fell below 4 percent with the trough in mid 2019, saw the most optimist changes. This was undoubtedly tied to the jump in payrolls forecasts, which rose by about 20,000 to nearly 200,000 new jobs per month over the next year. The strong jobs report last week drove both of these changes. Most other variables moved only slightly. Inflation expectations changed marginally, but mostly converged in the direction of the 2% Federal Reserve target. Crude oil price forecasts also fell modestly. Housing market expectations for this year and next were mostly unchanged. The consensus recession probability indicator fell slightly to 13.6 percent. Finally, we turn to the yield curve spread (the difference between the ten year bond and the federal funds rate) as we have in previous posts. We have an interesting development as short run forecasts through the end of the year see a riding yield curve spread, indicating a steeper yield curve, and the longer horizon (2020) showed a flatter yield curve. This suggests that forecasters are wary of an impending recession in the longer run. A quick post on the second installment of aggregate forecasts we look at real GDP Growth. As with the inflation forecasts in an earlier post, this measure aggregates several sources of real GDP expectations. Unfortunately there fewer sources and for now I hesitate to include the various Fed nowcasts. The graph below shows the historical real GDP growth rates and the aggregated expectations: 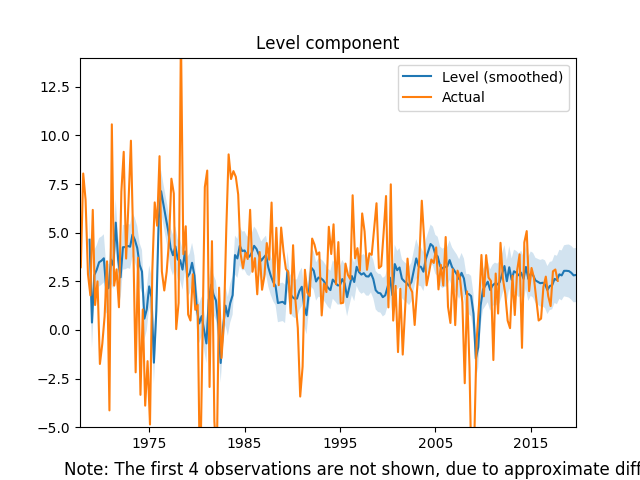 And here is the raw data: 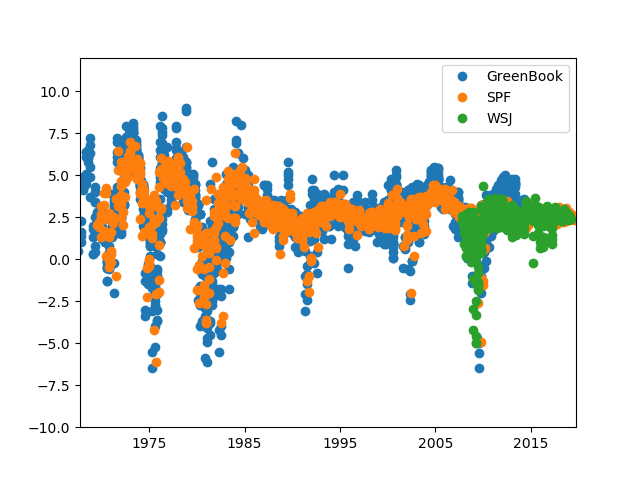 Finally let's zoom in on the last few years and the latest projections: 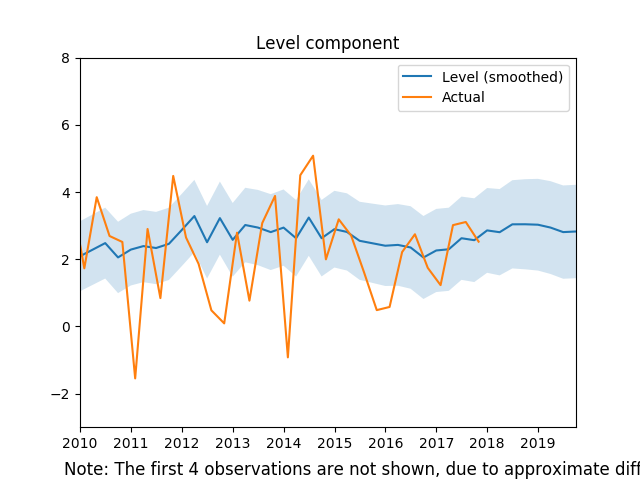 These aggregated forecasts suggest a robust 2018 and 2019. I suspect, however, that as those longer run forecasts will start to drift further down as the Fed raises rates in response to a tighter labor market.
The February WSJ forecasts are in and, in general, we are seeing good news. First off, 2018 Q1 expected GDP growth is up a quarter percent to 2.6 and the expected unemployment rates through 2020 all fell. The trough of unemployment is still hovering around mid 2019. Expected payrolls forecast rose by almost 8400, strengthened by the robust January employment report.
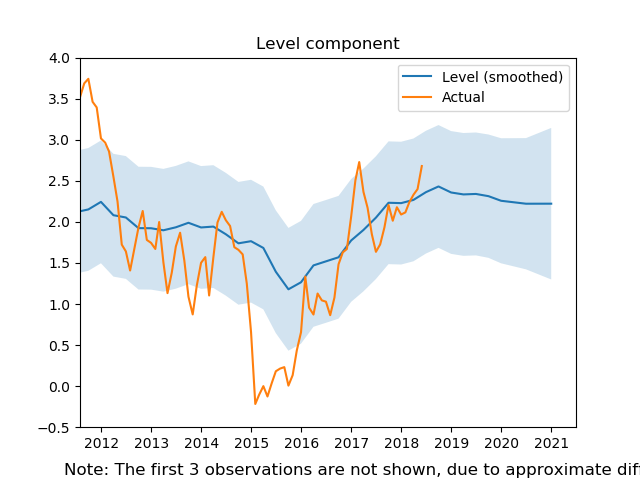
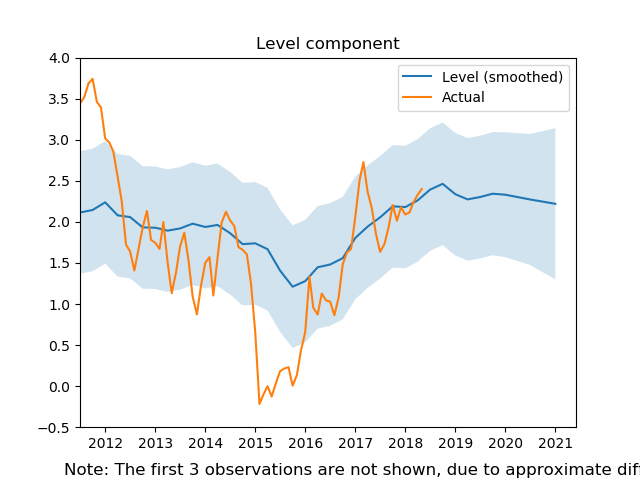
Inflation expectations increased again, standing firmly above 2 percent. Expected housing starts are more or less unchanged, but housing price forecasts for 2018 and 2019 both rose a tenth of a percent. We also saw a huge increase in crude oil expectations as almost all future prices rose by more than 2 dollars, with price expectations above 60 dollars for the next two years. Finally, consensus recession expectations rose, but still remain low, with less than a 14 percent chance of a recession in the coming 12 months. As I have noted in previous reports, December and January Reports, the spread between the expected future federal funds rate and the ten-year bond rate has been tightening. This month, ten-year bond rate forecast all rose by over a tenth of a percent, whereas consensus expected Federal funds rate increases were more modest. This is good news for monetary policy makers, because they will be able to use the long end of the yield curve when the next recession begins. However, in the short term, particularly given the recent sell off of stocks, this presents a potential head wind against our waning economic recovery. I have started a new project with the goal of generating several series that aggregate expectations of macroeconomic variables. This post describes the inflation expectations series. Below I have plotted the results relative to actual year-over-year CPI inflation. 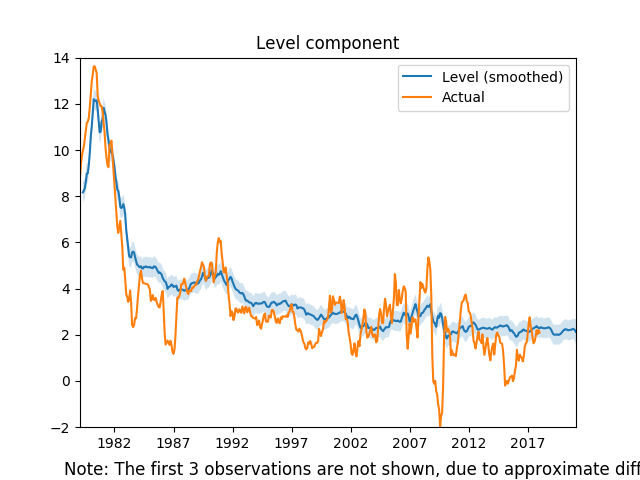 This series combines six different inflation expectations series: Federal Reserve Greenbook forecasts, Survey of Professional Forecasters, NY Fed Survey of Consumer Expectations, WSJ Survey, Cleveland Fed Inflation Expectations, and the Michigan Survey of Consumers. There are typically multiple forecasts for any given month over many horizons. To construct the series I create an average weighted by the inverse of the forecast horizon. Then in order to strip away some of the seasonal shocks I pass the resulting data through and unobserved components model. Here is the raw expectations data: 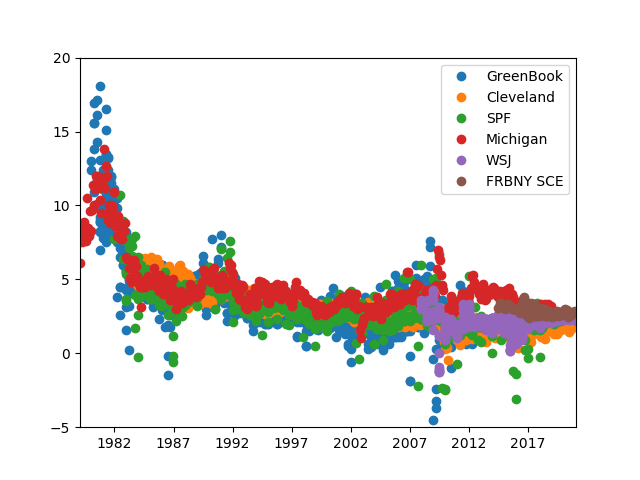 We can see that only the last few years of the series incorporate the NY Fed and the WSJ forecasts, and the Greenbook survey has a 6 year lag. As such the most interesting part of this new measure is the last several years of data: 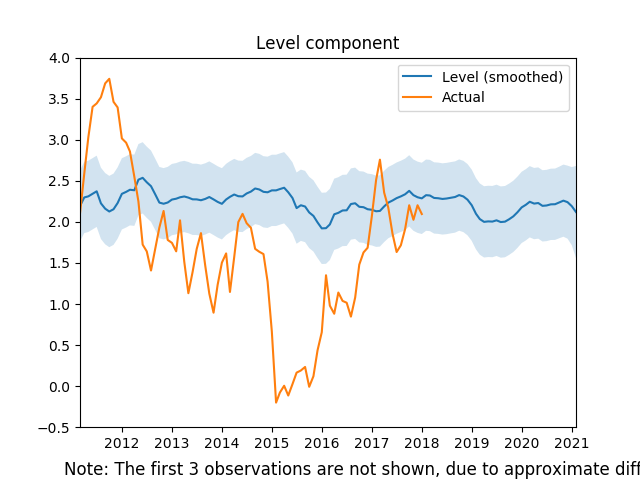 While the low inflation in 2015 did impact expectations (with a lag) the broad trend shows that inflation expectations are quite stable and slightly above 2 percent. This is good news for the Fed, but this series is influenced by Fed forecasts, so I dropped both the Greenbook and the Cleveland Fed forecasts in the graph below: 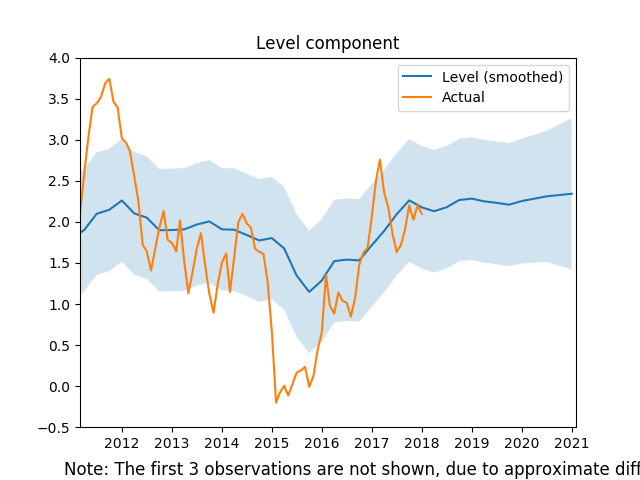 Interestingly, there is an even larger impact due to the 2015 drop in inflation, and it appears as if consumers and professional forecasters actually have lower inflation expectations in general.
While these graphs are useful, the methodology used in constructing the aggregated inflation expectations necessarily lost a lot of information. In the future, I would like to not only have the series for each month, but also the forecasts over the preceding 3 year horizon. With that information we could not only see what was happening to expectations, but also how those expectations of a particular point in time were evolving. Please let me know your thoughts... |
Archives
May 2018
Categories
All
|