RSS Feed
|
The recent release of second quarter GDP growth came in below WSJ expectations as well as a downward revision of first quarter growth (from 1.4 to 1.2). This new data follows weak inflation numbers from last week. 1. For the past two years expectations exhibit an upward bias. Which, if that bias holds true, means low future expected growth would indicate even lower actual growth. Projected growth in 2018 is 2.38 percent, and 1.94 percent in 2019. These are significantly below the administrations overly optimistic 3 percent promise.  2. Expected federal funds rates have been falling since the beginning of the year. Not by a lot, but it has been consistent, suggesting that new data will give the Fed pause in increasing their target rates. 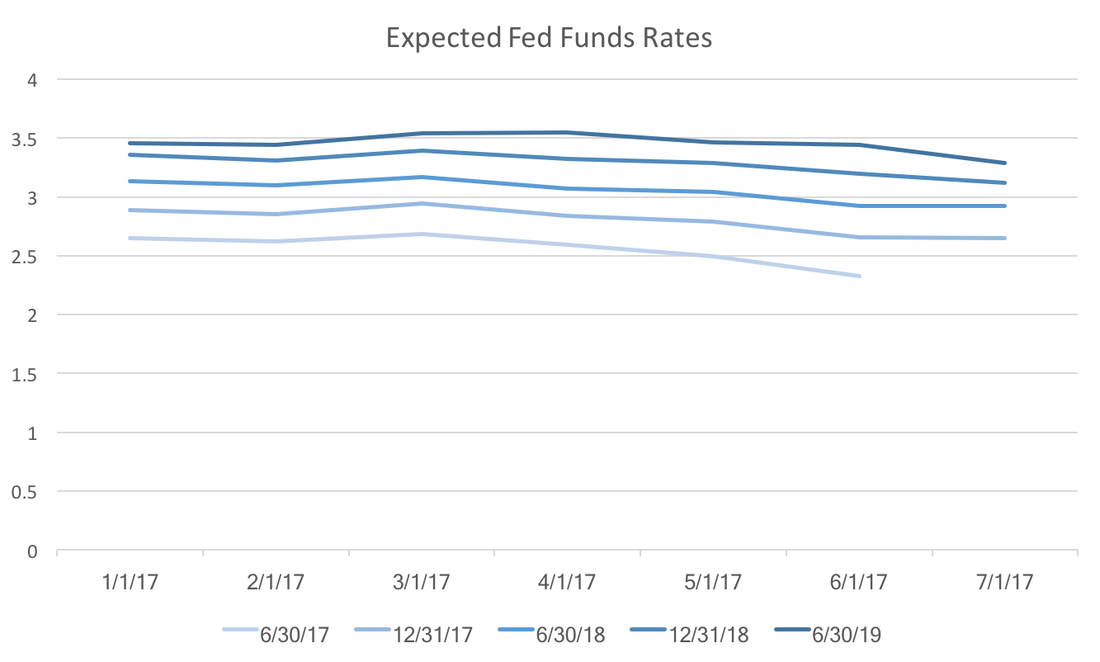 3. Expected housing starts continue to fall. At the beginning of 2016 expected housing starts were quite robust, however, subsequent data have curtailed consensus optimism. If this expectation falls below 1200, that could be a signal the beginnings of a slow down in the housing market. 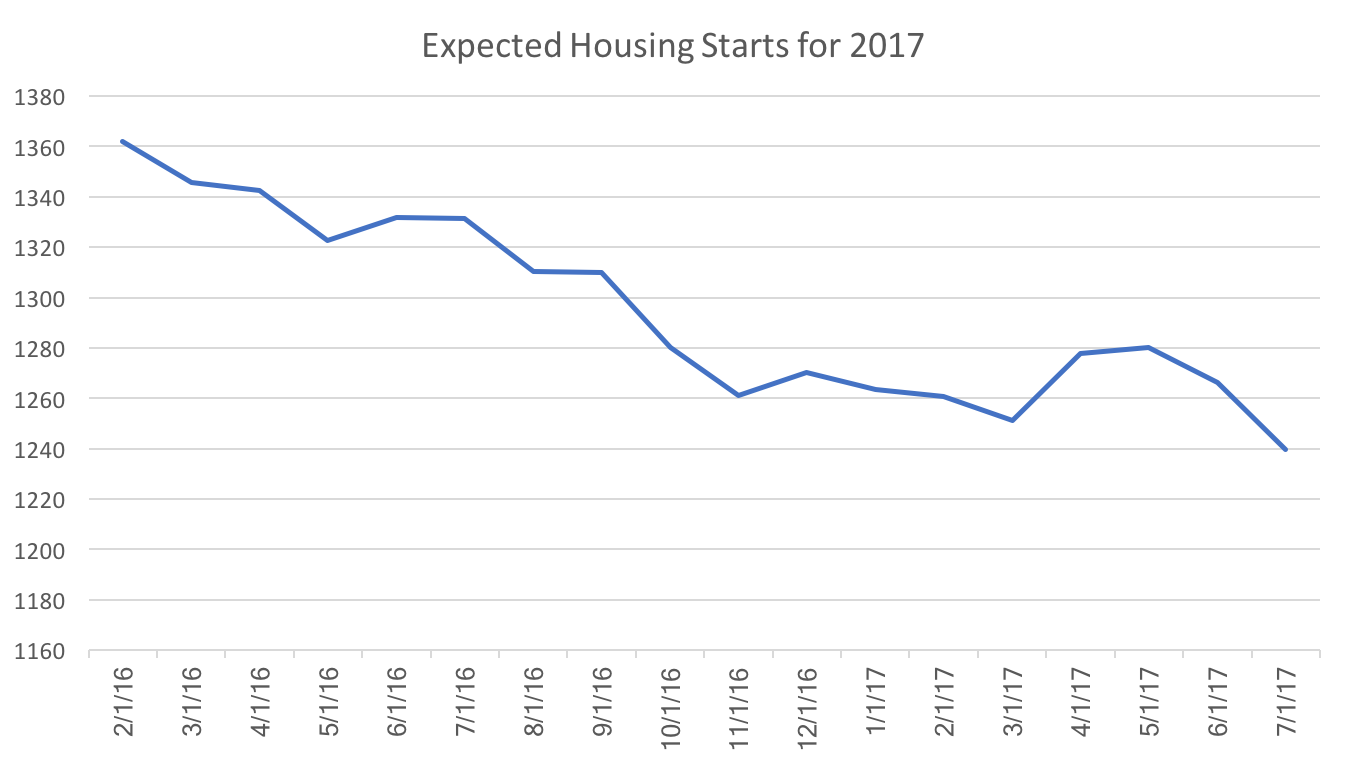 While there some signs of growth remain, these three sets of expectations should worry investors and the current administration. All indicate at the very least, that the economy will not grow particularly quickly in the coming year. In the worst case scenario we may see the beginnings of a recession by the end of 2018.
0 Comments
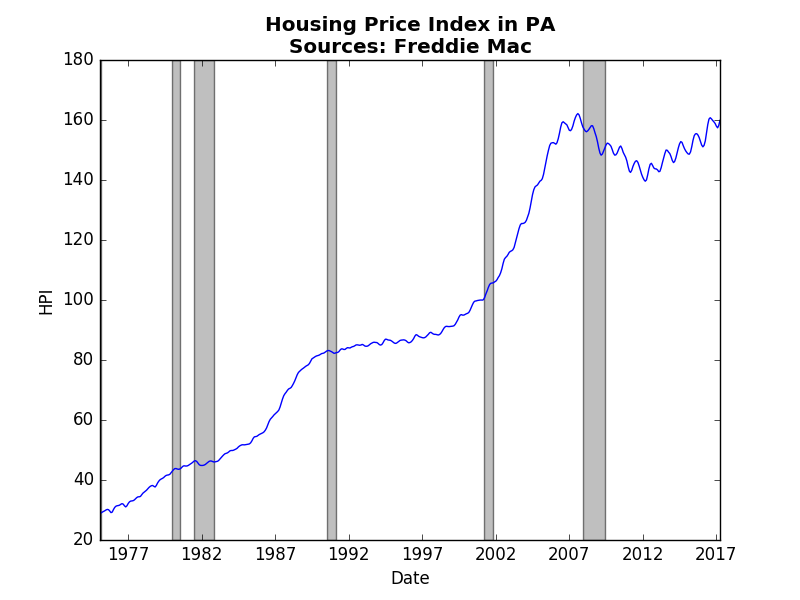
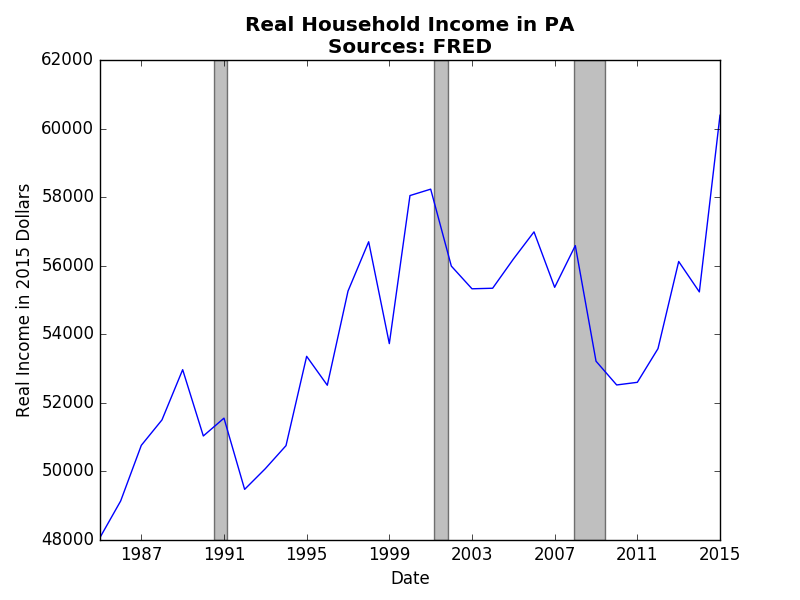
Housing prices in the US have crossed their pre-recession levels as shown in the graph below. Housing prices, much like many economic variables, tend to have an upward trend, usually exhibiting compound growth. This post uses state-level data on real household income and housing prices to explore the concept of endogeneity, or the chicken and the egg problem. 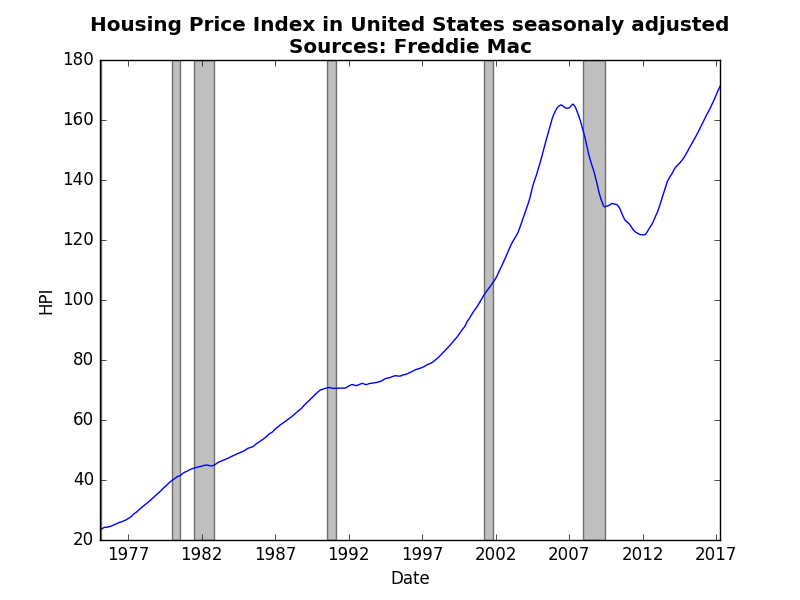 In economics, we frequently need to disentangle a vicious (virtuous) cycle. An example of a vicious cycle, a poor people tend to be the ones who purchase lottery tickets, which comes first: being poor or buying lottery tickets. This type of story exists in house prices and income in Pennsylvania depicted in the graphs below. Though real household income displays more volatility (the HPI is monthly and not seasonly adjusted) the general trends are more or less the same. What we might want to know is whether housing prices impact real incomes or the other way around. Clearly as people earn more income they can afford to purchase a house. However, as we saw during in the lead up to the great recession as housing prices start to soar, more individuals receive income from real-estate, either through sales, rentals, or "flipping." Macroeconomists utilize the irreversibility of time as a way to control or mitigate endogeneity. Something that happens today surely cannot impact what happened yesterday. After converting the state-level data into annual growth rates we can evaluate how lags (old values) of data impact current values. The table below reports those results. 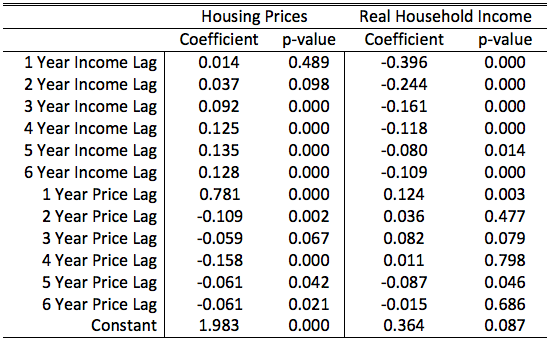 In these tables we see an interesting pattern. First, and not surprisingly, the lag of the dependent variables are all significant. Past performance influences future performance. Real household income exhibits a significant but weak negative response to the past. If last year was a good year this year is likely to be a little worse. In contrast, housing prices exhibit positive response to the past. If last years housing prices grew by the same amount as the previous four you can count on a year that is at least as good if not better.
The more important results are the off-lags, or how past prices influence income and vice versa. For housing prices, we see a relationship that is not too surprising. A build up of positive real income over distant past will lead to an increase in house prices. Intuitively, several years in a row of positive income growth leads to higher demand for houses, which drives up prices. The impact of housing prices on income is less clear. A rise in last years prices increases income (and maybe even the 3 year lag as well), which makes sense, since as price start to increase we can expect more sellers to join in. However, the 5 year lag is puzzling. I suspect that this is an artifact of the great recession. What we found was that both stories have some truth to them. It seems that the strength and duration of the impact of income on prices seems more and longer than that of prices on income. Therefore, it seems more likely that the recent increases in housing prices are in response to increased real incomes rather than housing prices predicting future real income increases. Technical notes: both regression included fixed effects by state. Data was from 1986 to 2015 for all fifty states and DC. Liberty Street Economics just posted about their recent housing survey. They see a sharp increase in the housing price expectations by consumers. That local level survey reinforces the expectations of the WSJ forecasters. The graph below depicts the consensus expectations for housing price growth for the year of 2017. The light yellow line shows the actual annualized growth rates. 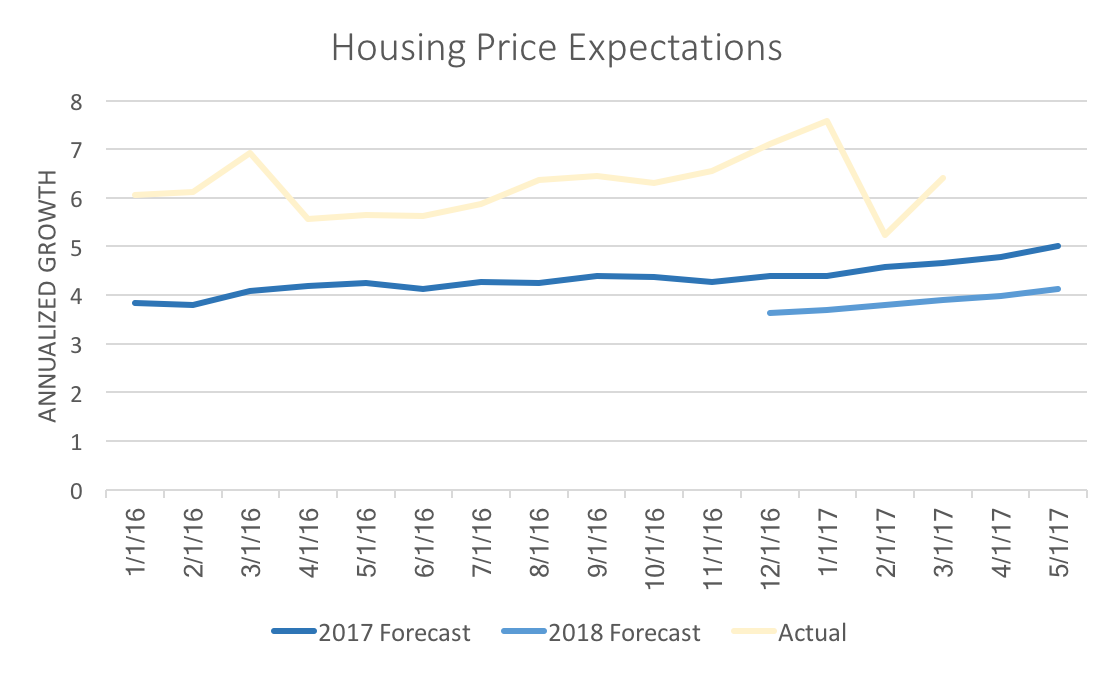 Liberty Street shows changes of expectations from one year to the next, but with the WSJ forecasters we are able to observe a steady increase in estimates over the last 15 months. Predictions for 2018, while lower than 2017, also have become more optimistic. This is partial due to continued rapid growth of actual house prices. Again, the data above corroborates Liberty Street's story using different data (FHFA housing price index supplied by Freddie Mac vs the Case-Shiller index used by Liberty Street).
Housing price growth is expected to slow down, however, both consumers and financial professionals agree it will not slow down too much. |
Archives
May 2018
Categories
All
|