
 RSS Feed
|
The International Organization of Vine and Wine has recently released projections of wine production in 2017. It does not look good. By their forecast wine production will fall approximately 8.2% in 2017. They blame this calamity on poor climate conditions in Europe, which saw the largest declines in production.
Do not despair or start loading up on wine too soon, these numbers are only preliminary estimates. Using the previous press releases I found that the revisions to the estimates tend to be positive. Initial estimates are revised upwards by about 2 percent on average, but they could increase by as much as 7 percent. However, if the drop off in production is realized we can expect higher prices at the liquor stores over the next year, particularly for European wines. Based off the OIV press release, Argentinian wine might be the way to go since their production is estimated to have increased by 25 percent.
0 Comments
A good friend of mine, Chris Gibbs at UNSW-Sydney, mentioned some of the things that led to Puerto Rico being in its current debt position (hurricane not included). This post tells that story in graphs. The first is one that everyone has been talking about, that Puerto Rico has been in a recession for several years: 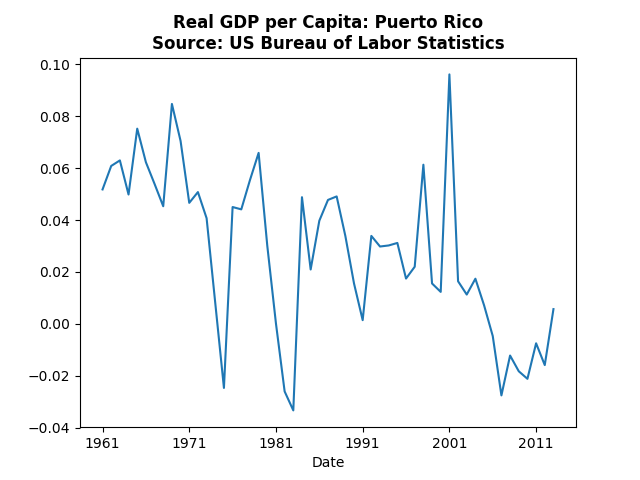 Real GDP per capita has been negative or just barely above zero from 2005 until 2013. Note that the downturn occurred prior to the financial crisis. Before that Puerto Rico enjoyed strong growth except for the impact of the recessions in the 70's and 80's. The gradual decline in GDP growth also makes sense since they were catching up to mainland United States. The argument some bring up is that the local government has been spending too much, instead the long recession lowered tax revenues. One might argue that the Puerto Rican government should have controlled the situation, but the reason for the sudden prolonged recession was actually due to US policy. Prior to 1996 Puerto Rico benefited from a provision in corporate tax law that encouraged businesses to locate there. However, Bill Clinton signed a law in 1996 that would undo that special status, because companies were perceived to use that law to evade taxes. Ten years later that law took full effect. And here were the consequences: 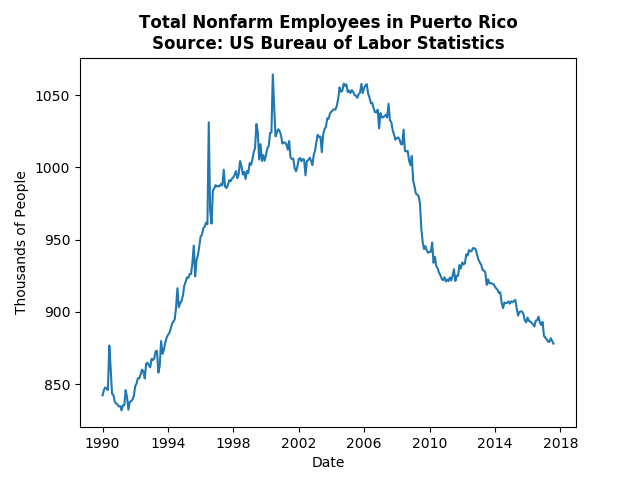 Jobs just started disappearing after 2006 and have not really recovered since. To be clear, the bill that Clinton signed was likely appropriate policy in terms of corporate taxes, but it failed to consider the ramifications to the people of Puerto Rico. Where did this drop off come from? Well take a look at the pharmaceutical/chemical industry: 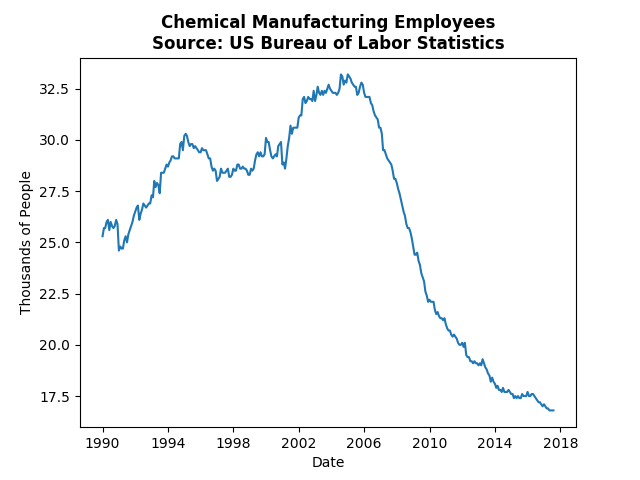 That steep decline starting in 2006 was a direct result of the tax policy changes. As the businesses left, and the high paying jobs left with them, the impact was textbook economic death spiral. Consumption of services by the wealthy who have left disappears, which causes those service industries to fire their employees. Those employees no longer have money to afford other goods and services and so the firms that rely on them have lower demand an must fire some more employees and so on.
Puerto Rico did have 10 years to prepare for the change, and they did end up signing some territory tax incentive laws, but after decades of special tax policy they probably did not understand the impact of losing that status. Which is to say, when the administration blames Puerto Rico's current debt and predicament on bad policy the administration may be correct. Except, the bad policy was the Federal government leaving Puerto Rico in the lurch when taking away a major influence of the Puerto Rican economy. The latest WSJ economic forecasts are out, and they contained only a few negatives compared to the September edition. Major indicators of economic weakness were higher oil prices and lower housing starts, and Q3 GDP growth. The average third quarter GDP growth forecast dropped by about 0.25 percentage points, but this was offset by an increase in fourth quarter growth. The declines for housing starts were not very large. However, oil price forecasts all shot up by a dollar or more.
On the bright side, the spread between the federal funds rate and ten-year bonds tightened indicating less perceived economic risk over through 2019. Annual GDP growth increased across the board, though not by much. The consensus is for more than 2 percent growth through 2019. We also continue to see declines in the predicted unemployment rate, and the decline was stronger for the longer horizon indicating that forecasters are skeptical about a quick reversal in the job market tightens. Last month I discussed the likelihood of recession based on unemployment forecasts. The recession probability dropped a little (almost a quarter of a percent), and payrolls increased. The unemployment trough still is timed for the end of 2018, but the 2019 forecasts dropped more than the 2018 forecasts, which suggests that the window for the pivot point is expanding. That is, there is more uncertainty about when the labor market and the economy will start to contract. Several sources have discussed the possibility of a hosing bubble (see The Great Recession Blog). Most people who make this claim point to the following graph and say prices are now higher than they were pre-crisis: 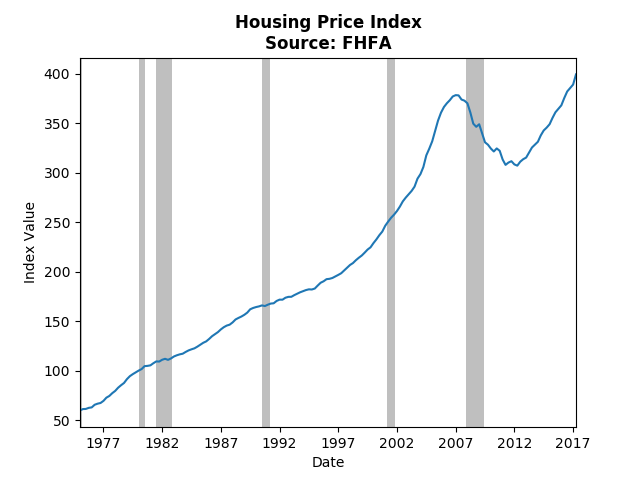 I think it is fair to say there definitely was a bubble before the recession, but the housing market has really only made it back to it's trend. If we look at a graph of the housing market cycle we can see that the previous bubble was due to spending almost a decade well above trend: 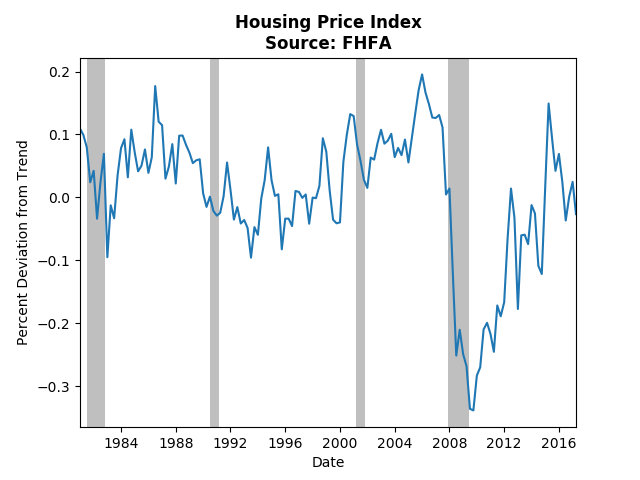 That decade led people to believe housing prices always increase and caused them to engage in risky borrowing. However, the drop in housing prices was so severe that it has taken almost a decade just to get us back to trend. Real estate loan data more or less supports this claim: 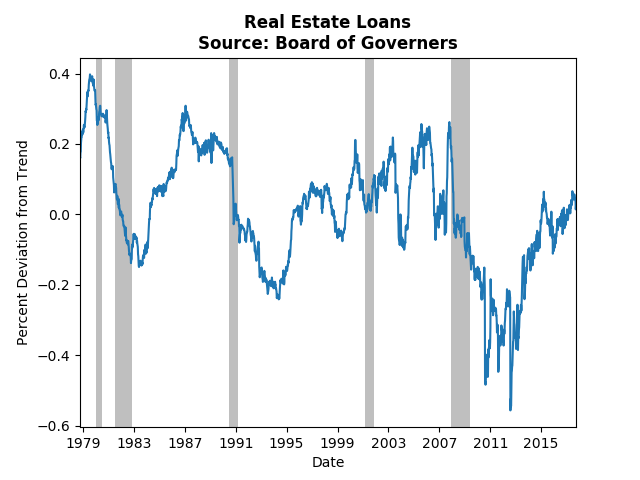 Realestate loans were severely depressed for about four years post recession, and only in the past two years have we approached the trend. One area where that may indicate the beginnings of a new bubble is housing starts: 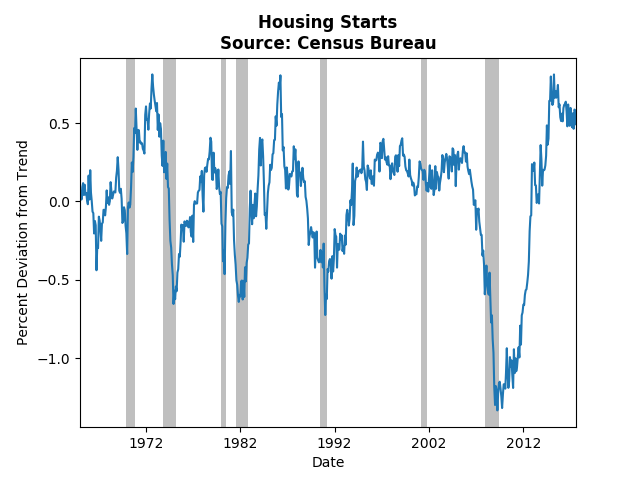 There have been very few experiences in the past 50 years where starts have been above trend this much for so long. One could argue this signals excessive growth in housing. However, the increase in supply should, according to basic economic theory, depress housing prices and stave off any bubbles.
Under the recently announced tax plan rates will be reduced for both corporations and individuals. When considering plans it isn't just the stated rate (12,25,35), or the effective tax rate (what happens after deductions and so on), but also how much income the government receives. This post shows that there despite the drop in income taxes, government receipts have more or less stayed constant for the past 70 years, however, corporate tax receipts have fallen dramatically. Using data from the Tax Policy Center, the graph below shows income tax receipts as a percentage of GDP and the highest marginal tax rate: 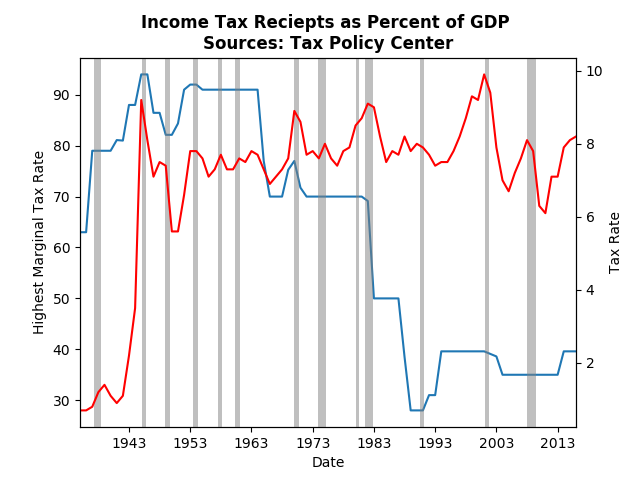 Note that tax receipts have more or less stayed the same (as a fraction of GDP) regardless of the highest rate. That's because the vast majority of taxes come from the middle. However, the peak of income tax receipts com after the Clinton tax increases in the 90's. It wasn't just the increase in taxes, but also the roaring economy, cutting into the standard arguments of higher taxes hampering growth. In a previous post, I show that tax increase actually lead to higher future growth and tax decreases are more or less ineffective. The graph that I find much more compelling is that of Corporate Taxes: 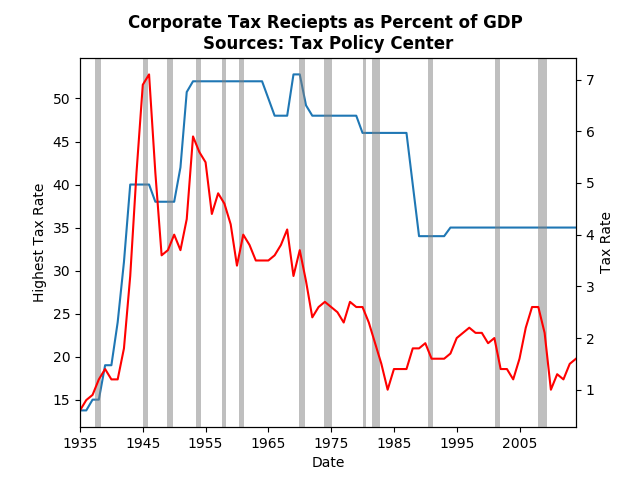 Given how much corporate tax receipts have fallen since WWII and how little corporations contribute to the government, it seems strange that they should receive such a large tax cut (35 to 20 percent). Again there have been plenty of discussions of the effective tax rate, which is actually on par with the rest of the world. It is possible that such a decrease would result in no change in receipts (observe the late 80's), but the political signal seems to say: corporations get a huge cut in burden even though they don't pay very much to the government, and the vast majority of people who do pay get very little change to their tax burden.
|
Archives
May 2018
Categories
All
|