
 RSS Feed
|
Over the past year there has been less disagreement across forecasters predicting the Federal Funds Rate, and unemployment. Not surprisingly as the forecast horizon (the time between the forecast and it's realization) decreases the agreement among forecasters increases. That is, there are fewer outliers because more is known. The WSJ Economic Forecasts display this property, however, using the payrolls employment forecasts we can isolate the changes additional variation outside of the monthly uncertainty. The graph below plots the normalized standard deviations for Employment Payrolls, Inflation, Federal Funds Rate, and Unemployment forecasts. 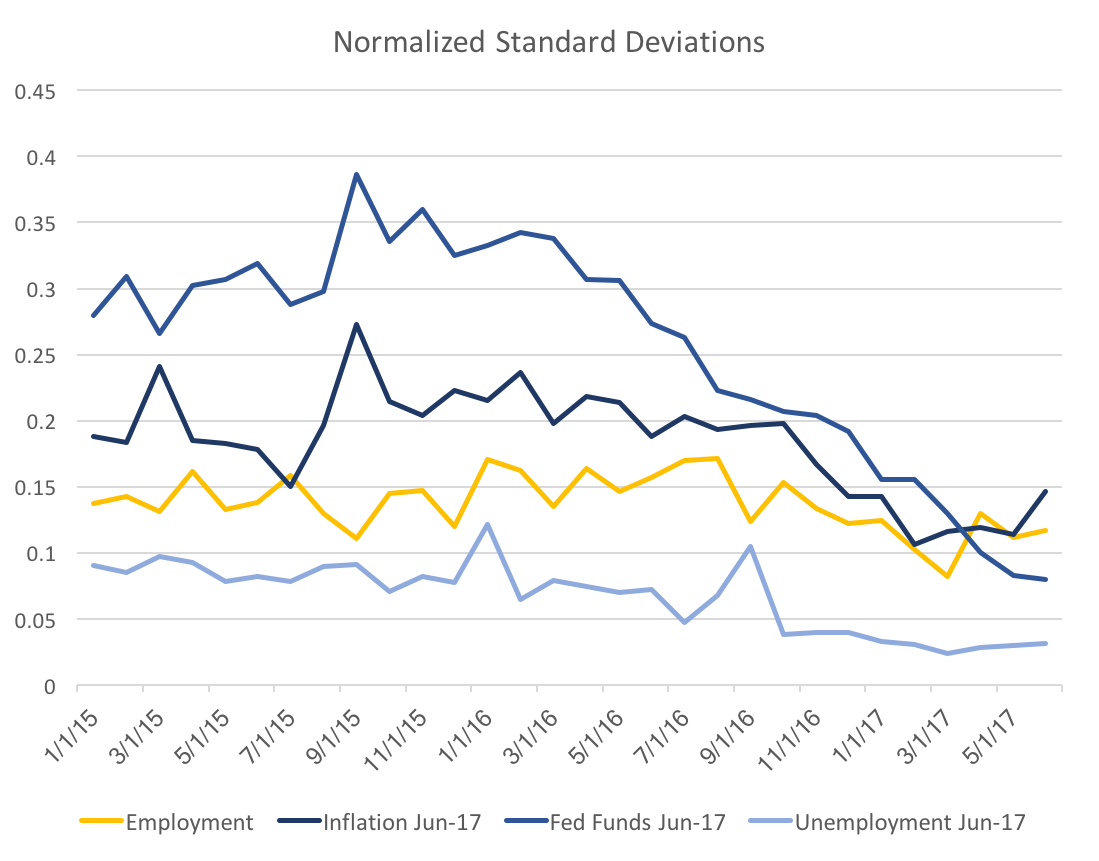 The yellow line of employment payrolls is stable, with a slight decrease in the past half year. In contrast, the Fed Funds Rate exhibits a very steep decline from a year ago. This is likely due to increased consistent messaging amongst FOMC participants as well as improved (and consistent) fundamentals. A large portion of the decrease is likely just due to the shortened horizon. The following graphs will display the forecast variability over all the forecast horizons. 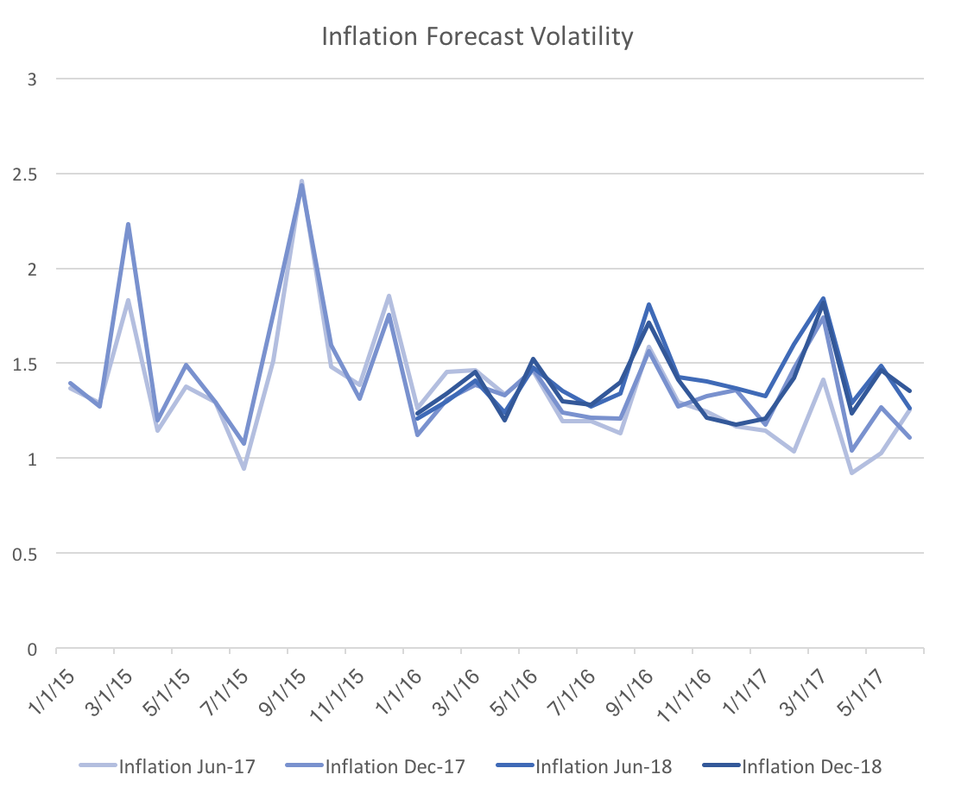 The graph above shows the four forecasts of inflation. Clearly once we control for the general uncertainty the slight downward trend of inflation forecast variability disappears. However, the graph below shows that that the downward trend very strong for the Federal funds rate forecast variability. 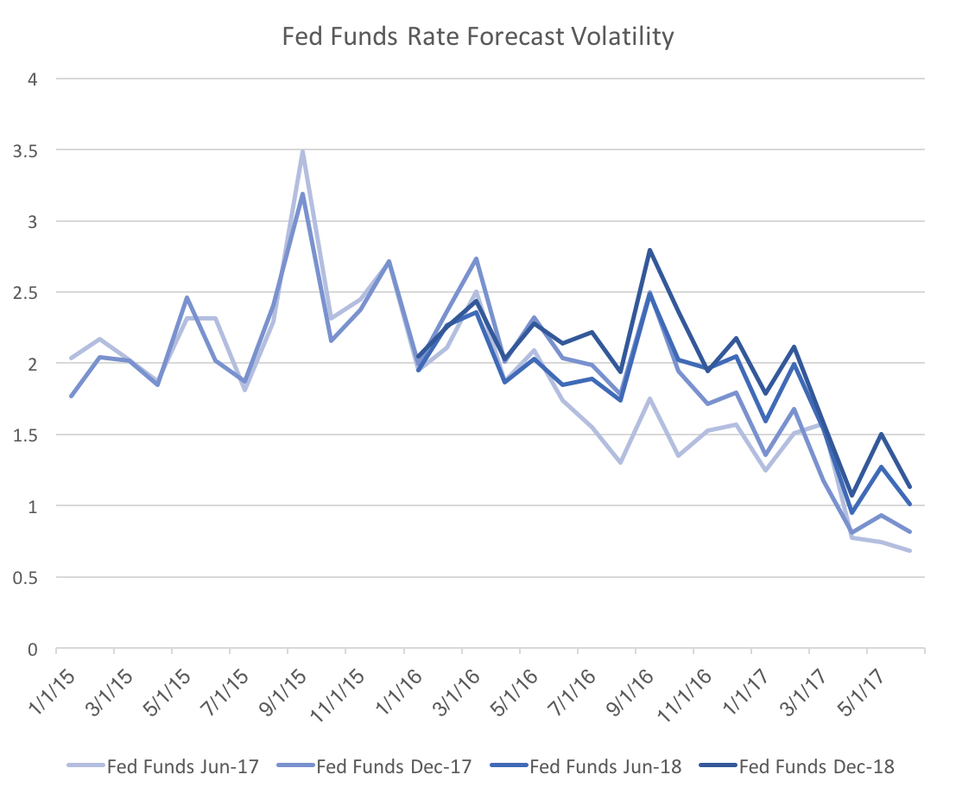 Also note that the drop is across all four forecasted dates, which implies that the result is not a normal change over forecasting horizons. Fed officials should be encouraged by this graph because it suggests the consistent messaging may be consolidating interest rate forecasts. 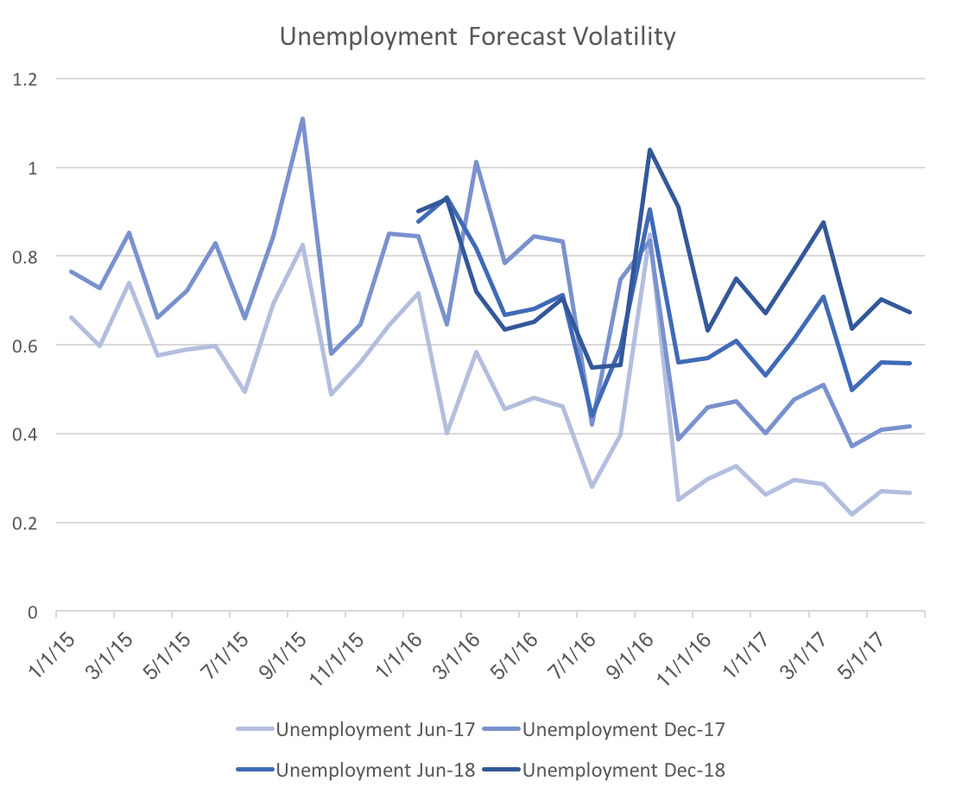 We see a similar, but slightly different graph for unemployment. Again it looks as though all four forecasted dates are decreasing in forecast variability. The main difference is that there is clear stratification across forecast horizons. From this graph it is unclear whether forecasters truly are more certain, however, I suspect the clear stratification across forecast dates indicates a typical spread of forecast horizon uncertainty.
0 Comments
Leave a Reply. |
Archives
May 2018
Categories
All
|