
 RSS Feed
|
Thanksgiving is on its way and that brings concerns about whether there will be a turkey at the supermarket. This post takes historical data on turkey production from the USDA to see what the turkey market is like. The first thing to note is that exports of turkey are up as a percentage of total production. About 8 percent of US production is exported: 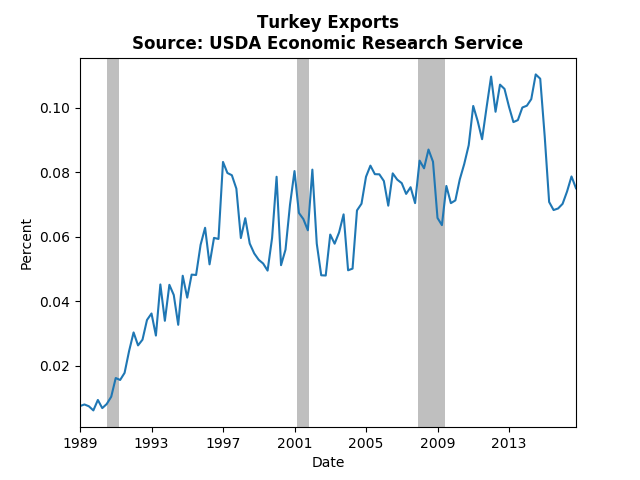 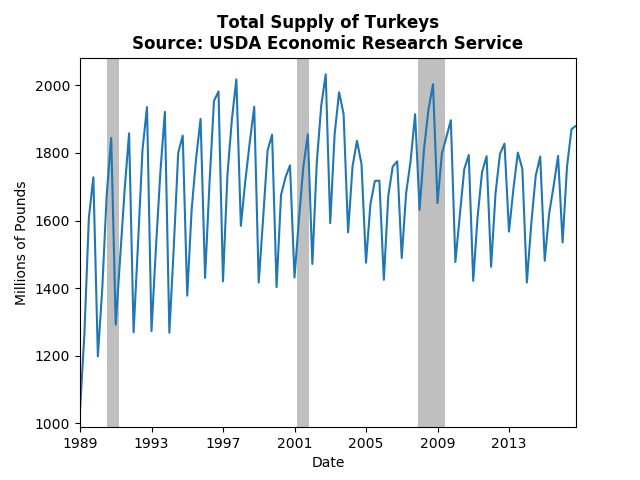 The total supply (less exports) has stabilized since the early 90's and there seems to be a long run periodic cycle layered on top of the usual seasonal cycles. However, if we look a bit closer at the data we can see that there are some significant changes over the past 3 decades: 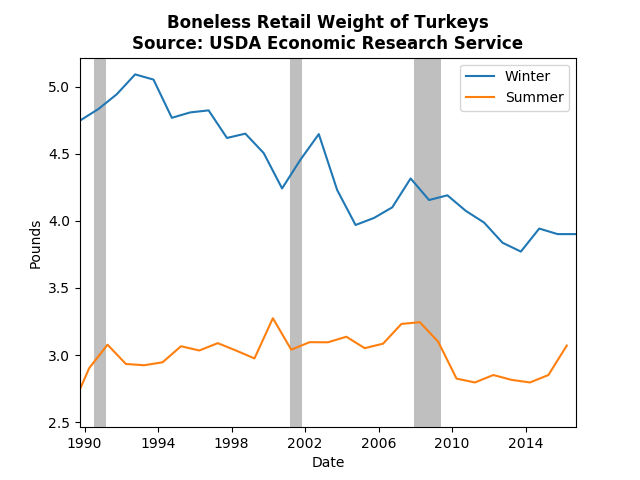 It appears we are consuming less turkey during the fourth quarter, basically our turkeys are getting smaller (the graph is similar for the full turkey). The comparison of summer to winter tells us that this isn't a general phenomenon, it really is only the Thanksgiving/Christmas boom that appears to exhibit a reduction in quantity.
Bottom line, I think our thanksgivings are including a lot more fixings than they used, which I very much appreciate.
0 Comments
The most recent economic data continues to suggest a robust economy, and the WSJ Economic Forecasts reflect those facts. This post will present a brief overview of the changes in the average WSJ forecasts.
The main highlight from the GDP forecasts is a tenth of a percent increase in annual GDP growth for 2017, though only one quarter exhibited a decrease. Inflation forecasts also inched up in the near term (through 2018), but fell slightly post 2018. The positive employment reports have caused the predicted path of unemployment to shift down by almost a tenth of a percent as well, but the predict peak of employment is still around the end of 2018 or beginning of 2019. The probability of a recession in the next 12 months decreased by more than one percentage point to 14.6 percent. The expected spread between the ten-year bond yields and the federal funds rate continue to tighten. This means that the yield curve may flatten out over the coming years. If that comes to pass monetary policy makers will not have as many tools at their disposal for the next recession since they will only be able to impact the short end of the yield curve. End-of-year expected crude oil prices jumped up by over 3 dollars, however, longer term forecast rose more moderately. Housing price growth forecasts continue to increase. The end of the 2017 consensus is now expected to reach 6 percent. However, expected housing starts declined slightly through 2019. All in all, the recent data has moved forecasters to have a generally bullish view on the future economy. With the robust initial estimate of Q3 GDP growth (3 percent) and a strong employment report (+261K jobs) we have more indications of a strong economy. While I think most of the evidence does point in that direction, I am concerned about consumption patterns. Personal consumption expenditures have been increasing at a steady rate, however the composition of those expenditures is surprising. Durable goods just do not appear to be returning to pre-crisis levels: 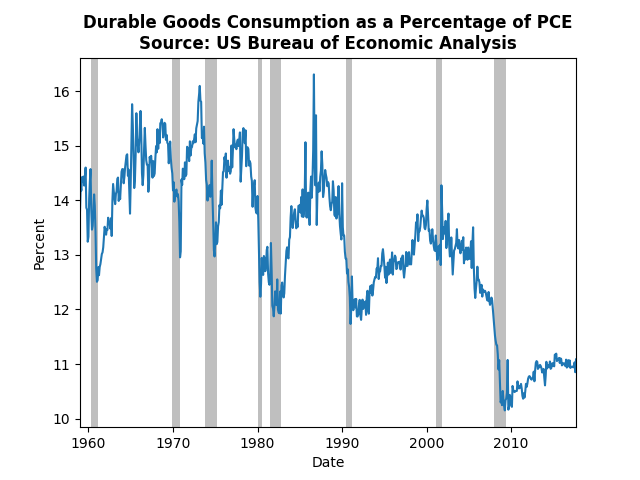 It is possible that this is part of a more general trend of decreasing reliance on durable goods, but the drop-off in the 2000's seems quite rapid. If the broad trend of decreasing significance of durable goods in our consumption bundle describes a change in the structure of the economy, that change may be accelerating. If however, the structure is more or less stable, then we have a long way to go before the economy gets back to normal.
|
Archives
May 2018
Categories
All
|