RSS Feed
|
The new data and data revisions of the past month have generated positive changes in my US forecast model. While the model still predicts a drop off of real GDP growth through the end of 2020, the rest of 2018 and the beginning of 2019 reflect the short-term fiscal stimulus. The model implies that by the end of 2020 we will return to the long-run average of about 2 percent. It would by incorrect to assume that the long-run forecast implies that there will not be a recession in 2020, since the model is not designed for long-run recession forecasting. 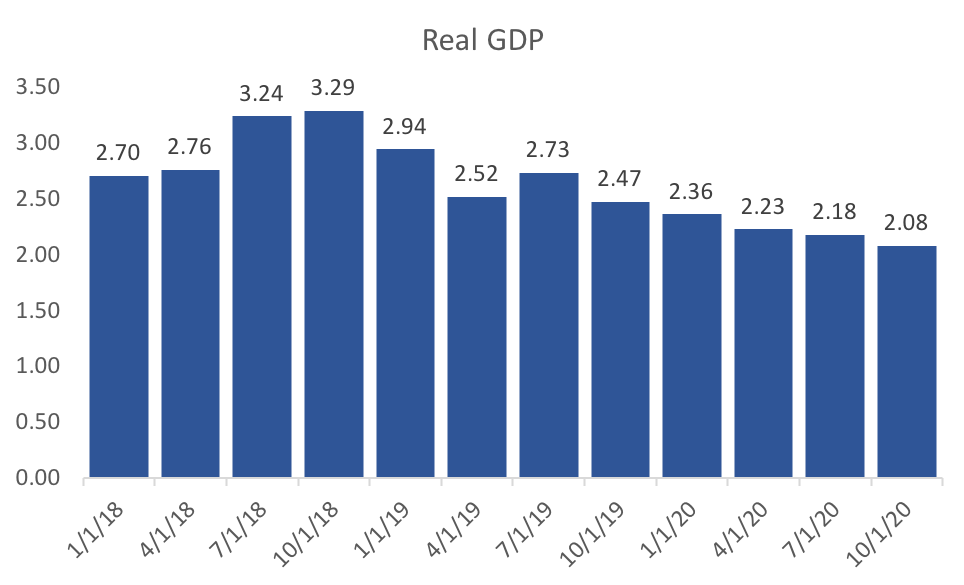 The recent increase in the federal funds rate has had a marked impact on the models inflation forecast, with inflation slowing through the end of 2019. This is, of course, the objective of monetary policy makers, and I suspect that the model is being overly pessimistic about Q3 2018. 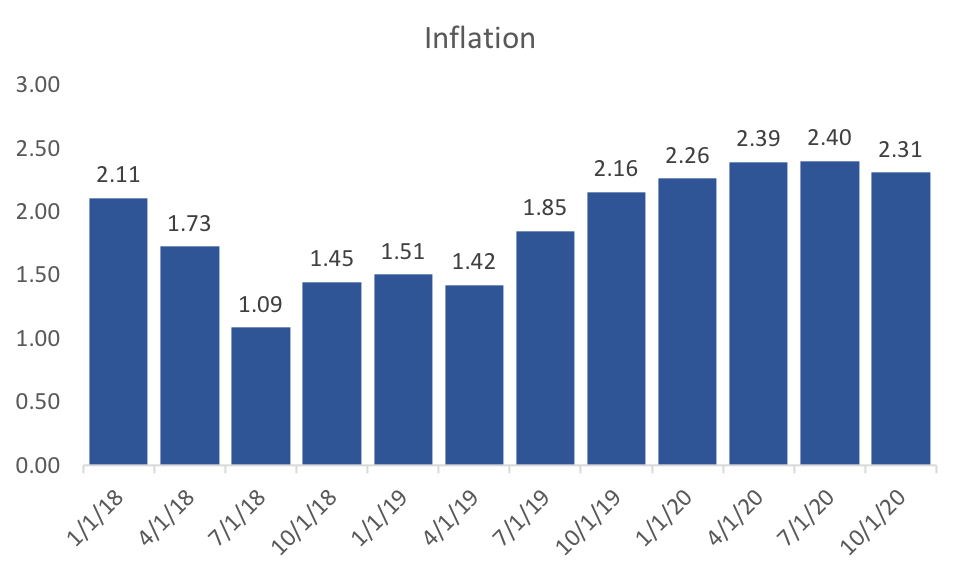 The models unemployment forecasts are starting to fall more in line with recent data releases. The trough of unemployment is still predicted in early 2019, with accelerating increases in unemployment through 2020. This could signal the potential for a recession by the end of 2020, and certainly would suggest that an economic head-wind or two could set off a recession in 2020. 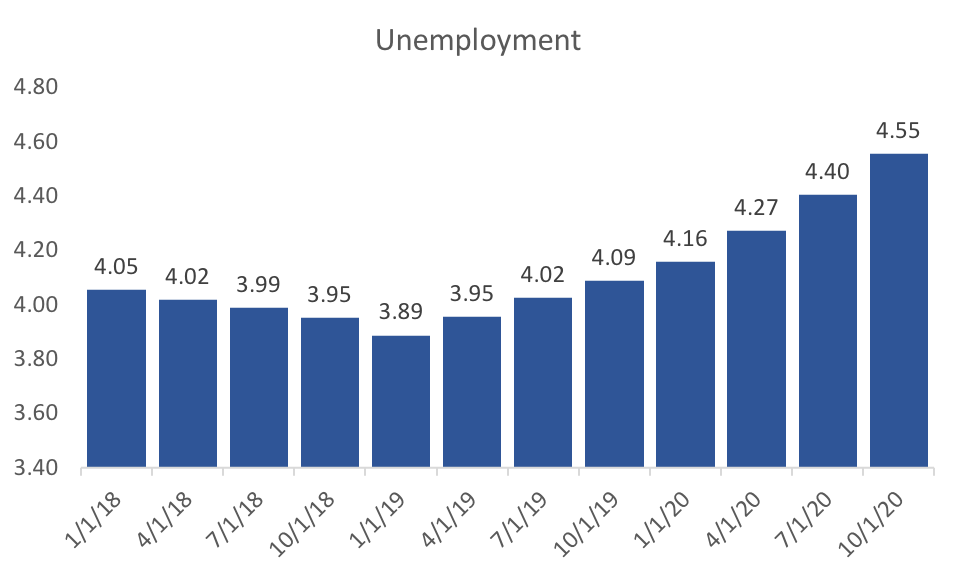 Just as I did in the previous month's forecast, I provide my aggregated expectations of inflation, real GDP growth, and the federal funds rate below.
0 Comments
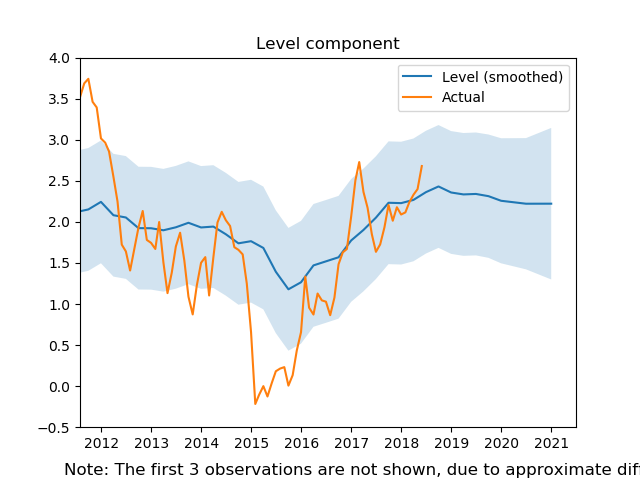
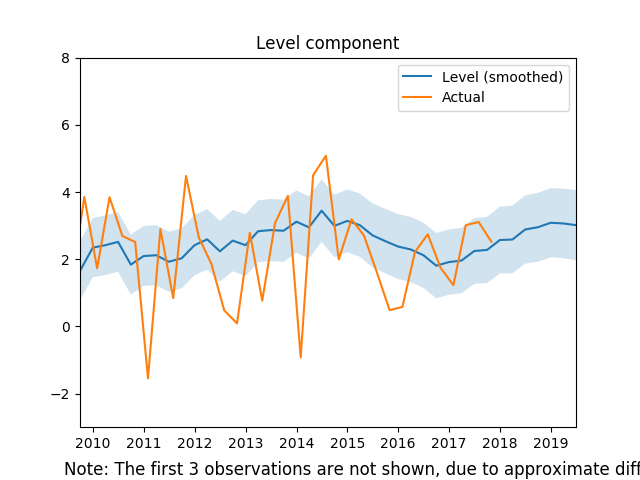
About a month ago I produced my first forecasts of the US economy. This posts updates those forecasts given the new data available. The time-series model has several novel components. The most important of these components is aggregated expectations. Using expectations data from several sources I construct a new measure of expectations for real gdp, inflation and the federal funds rate. Instead of using the expectations directly (treating them as exogenous) I instead treat them as endogenous variables that are concurrently forecast with the VAR model. That is, I am forecasting the forecasts. Another novel component of my forecasts are constructed variables that measure the cycles within various "sectors" of the economy. In addition, to the four sectors in my previous forecasts (manufacturing, labor market, housing market, and financial market), I have also included an international sector. This might be an important addition given the recent discussions about tariffs and potential trade wars. The first step in the process creates cycles for each of the data series in each sector. Then, using dynamic factor analysis, I extract the common factor (or two) for each sector and use those in my forecasting model. The following three graphs display the quarterly forecasts of real GDP, CPI Inflation, and the unemployment rate. Below I dive into some detail to show the importance of expectations and the sectors in this forecasting model. 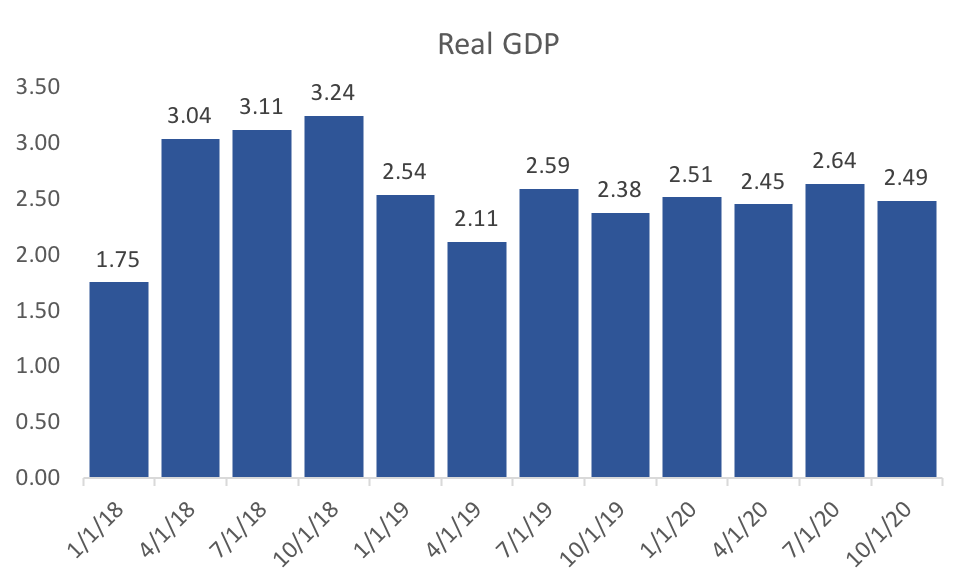 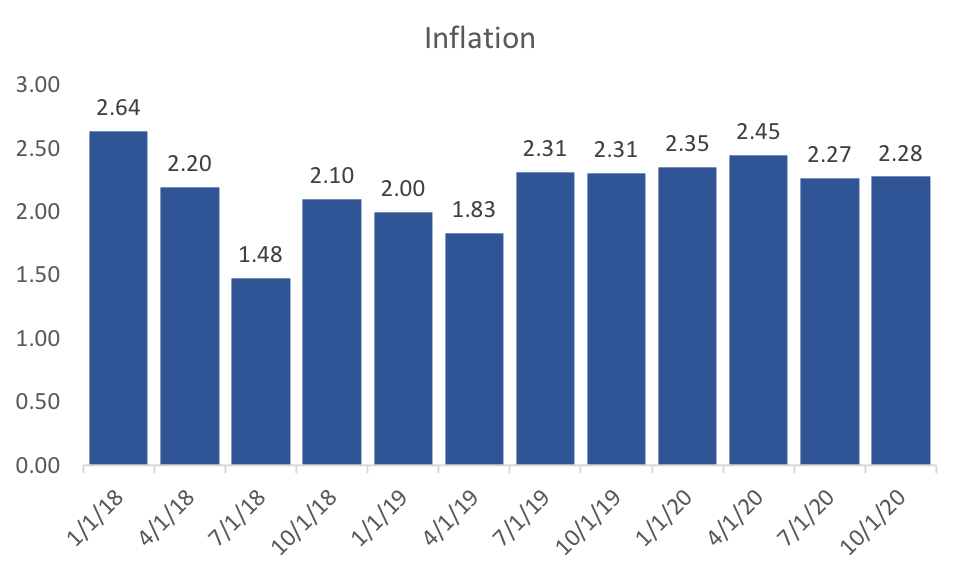  Unemployment change significantly since last month indicating that we are currently in the trough and that unemployment will remain more or less stable until mid 2019. Inflation is expected to be quite high in the first quarter, but drops of pretty dramatically to the Fed's 2 percent target. Real GDP projections for the first quarter of 2018 dropped off quite a bit since last month. In addition, the forecast for unemployment is very pessimistic. One might think that these changes are likely because of the recent jobs report. An alternative hypothesis is that it reflects the changes of the real GDP expectations variable (see my analysis of the April WSJ Forecasts). Below I test those hypotheses: 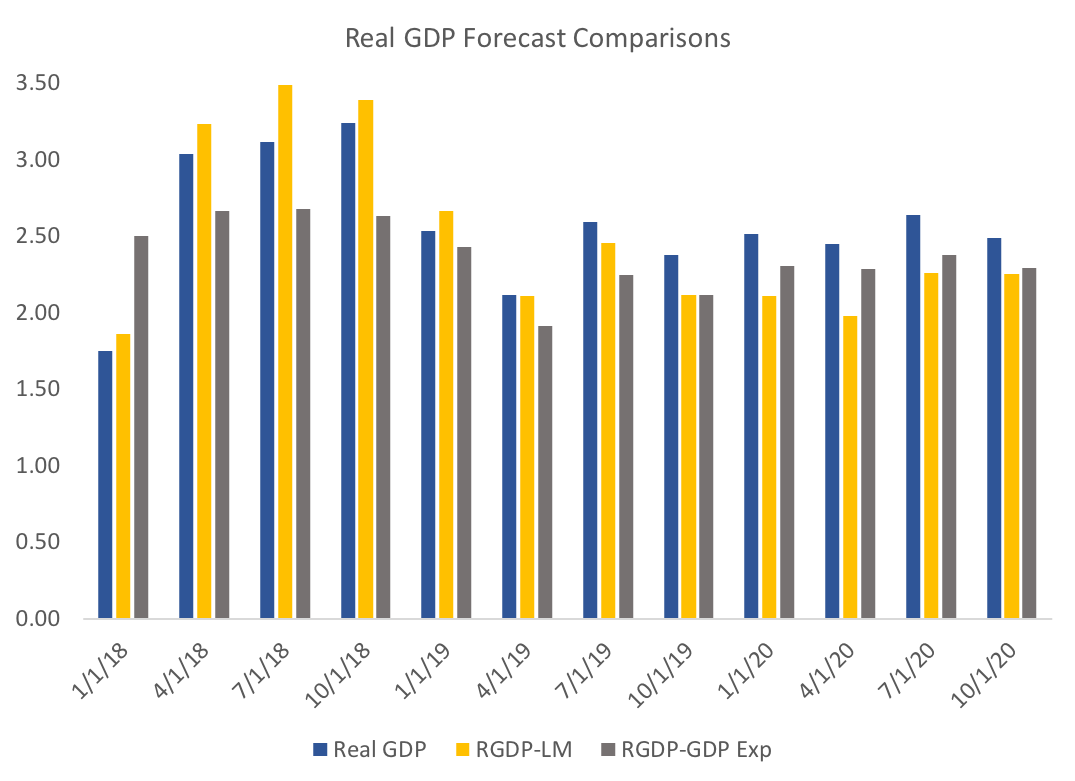 It seems as though the model with out the labor market data would still have more or less the same result in terms of GDP forecasts. However removing GDP expectations data had a huge impact on Q1 forecast of GDP. Recall that the model does not use the expectations data directly, but instead treats them as endogenous variables that can help explain GDP and other variables. 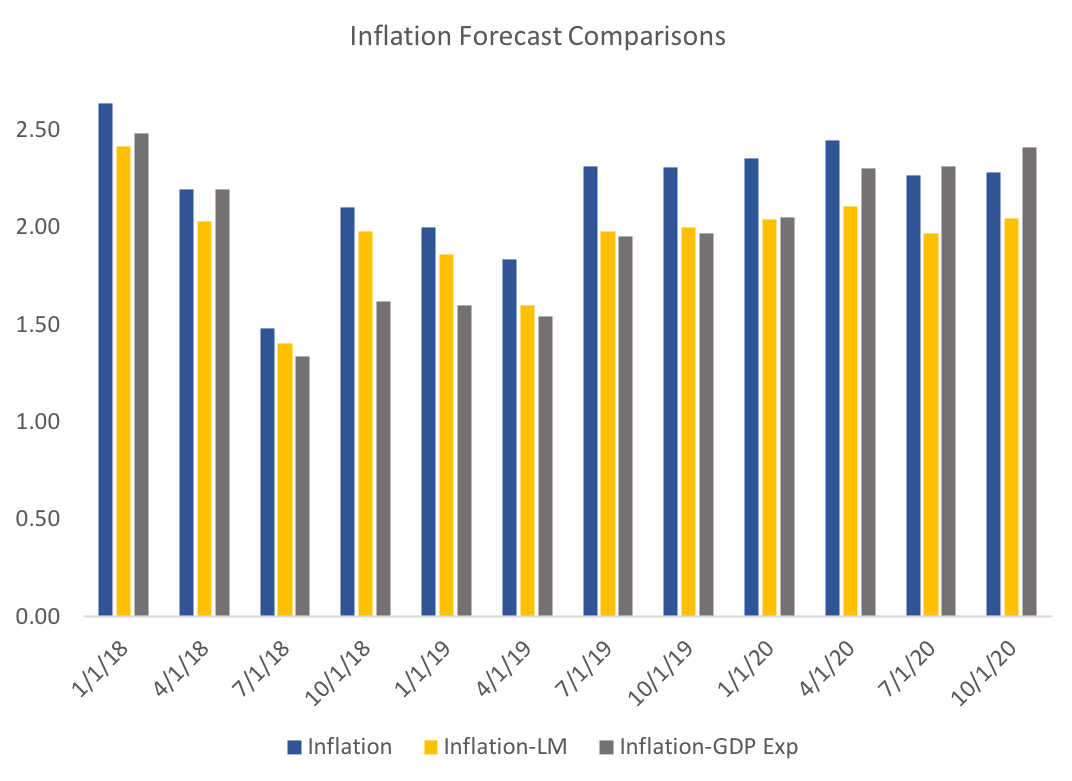 Turning to inflation, there is less of a difference between the models in the short run, however, in the long run the lack of labor market data suggest inflation rates closer to the Fed's target. 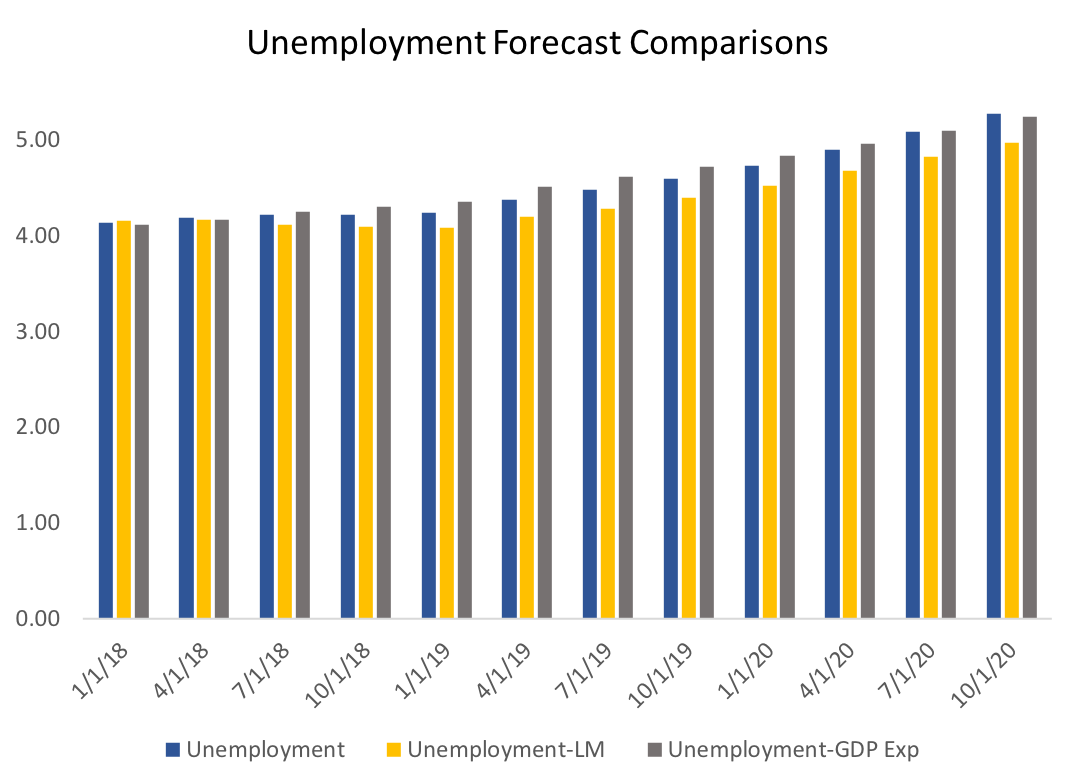 Finally, what I find the most interesting graph, though the most subtle. It seems that the recent labor market data has a strong impact on the dynamic in the unemployment rate. Without the labor market data we see a trough occurring in mid 2019. This suggests that, while the jobs report doesn't have a large impact on GDP, it should change our expectations about unemployment. In addition, expected GDP appears to have a dramatic impact on short-run forecasts of GDP.
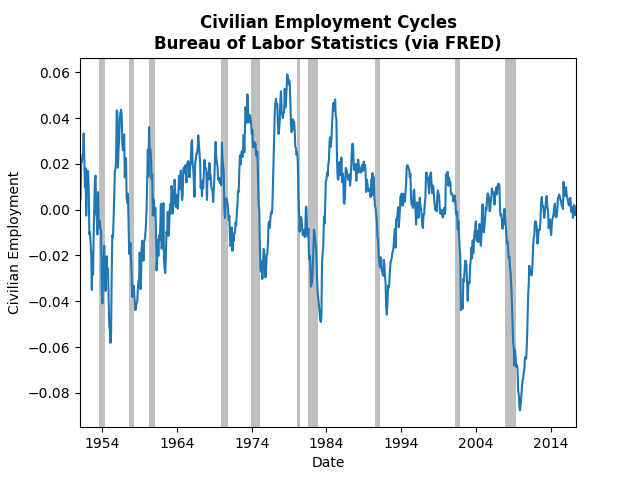
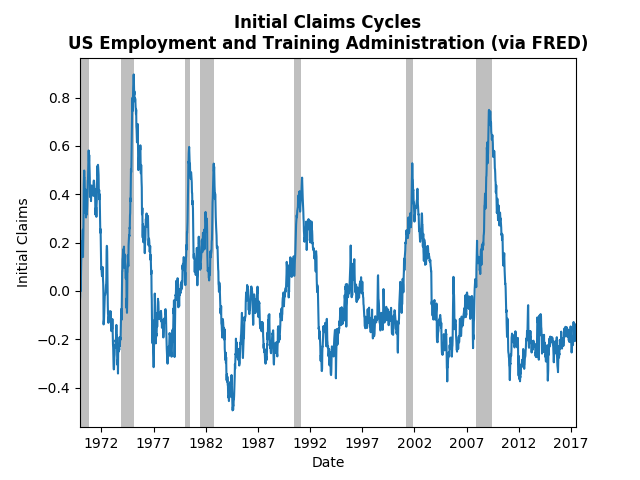
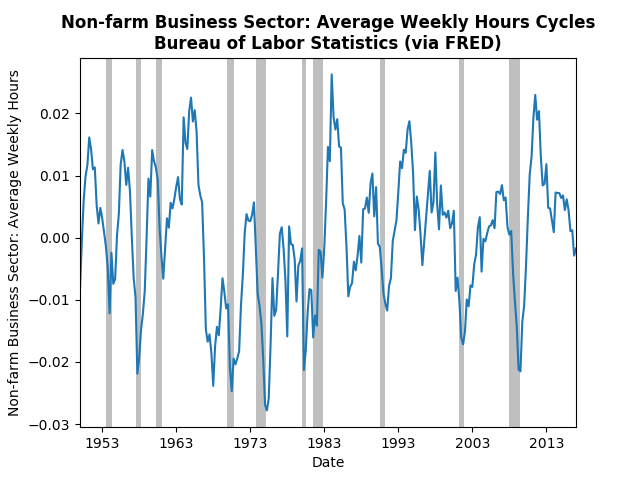
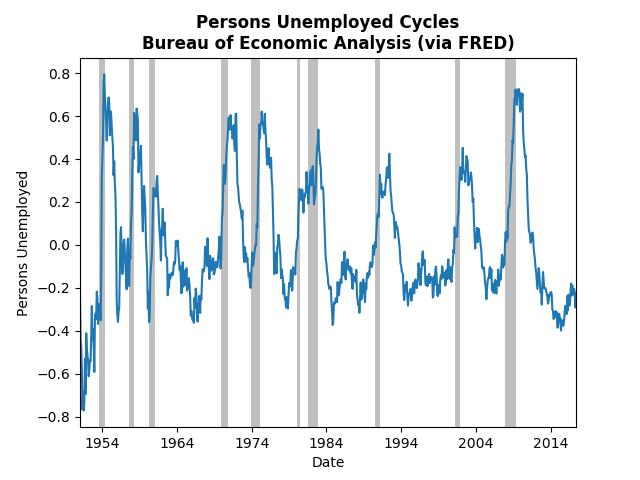
Many of my posts have focused on the WSJ economic forecasting survey. However, I have decided to include my own projections of the US economy. For now I will focus on headline economic data, namely Real GDP, Inflation, and Unemployment, but I plan to add more macroeconomic indicators as I develop more models. The unique aspect of my forecasting methodology is grouping some data series into few sectors (financial, manufacturing, housing, and labor) and including the aggregate measures of expectations I have previously discussed. Please see those previous posts for the methodology behind the aggregate expectations. The sector data uses the cyclical components of several data series within a sector. For example, in the labor market sector I use payroll employment, initial claims, weekly hours, and mean unemployment duration. After generating those cycles I feed them through a dynamic factor model and extract a latent factor series, which I consider markers of broader cycle within the sector. The graph below shows those latent factors: 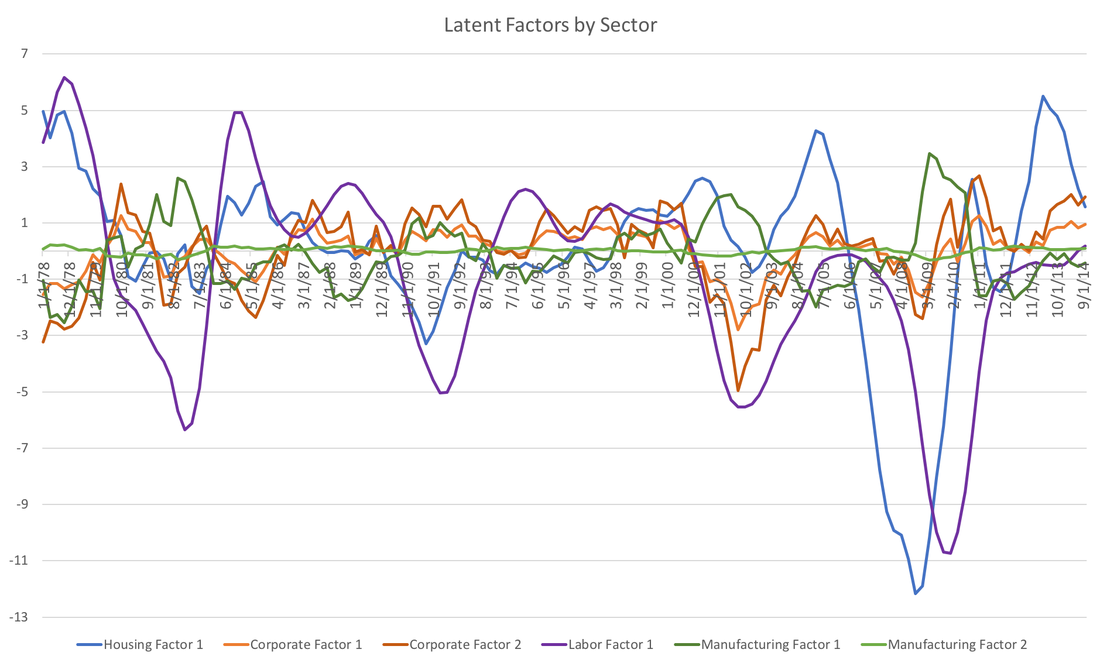 Combining those latent factors of those four sectors with aggregated expectations of inflation, real GDP, and the Federal Funds Rate, we run VARMA(4,0) and forecast 12 quarters out. The bar graph below presents the results for real GDP: 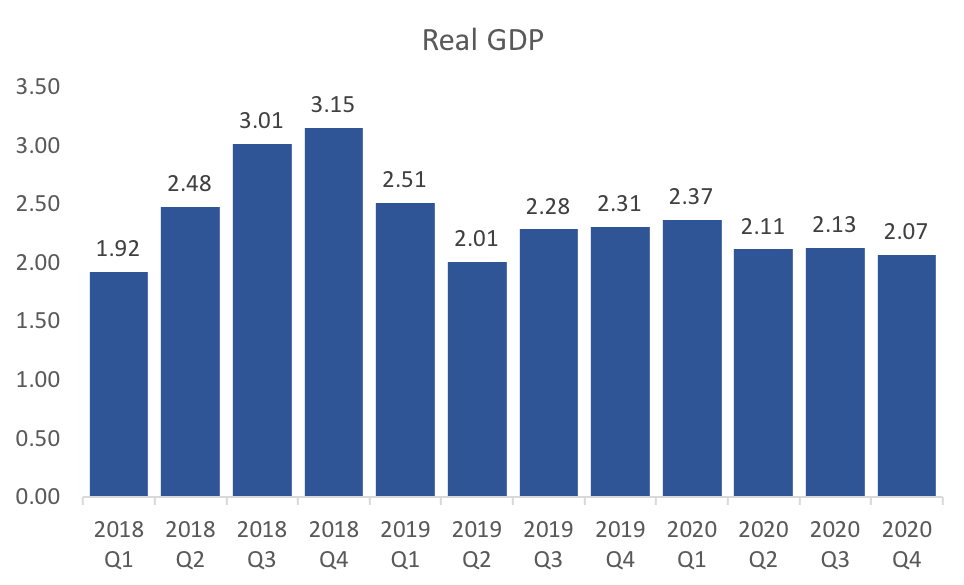 The model is optimistic about the second half of 2018. On the whole 2018 looks to be a quite robust year with 2019 showing signs of returning to the average long run growth rate. 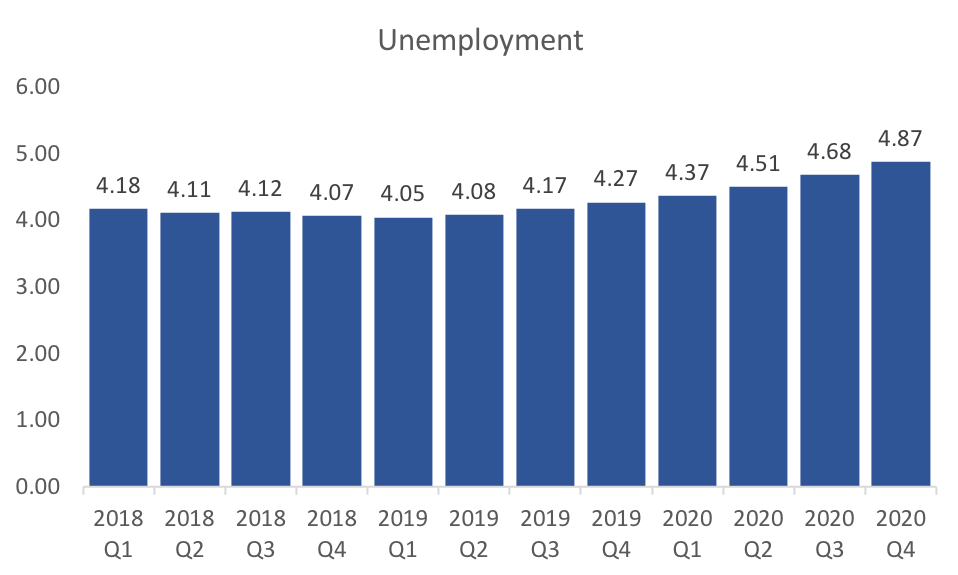 Turning to unemployment, the model is off a little on the level of unemployment, but I suspect that the dynamics are more or less a good prediction. The trough in unemployment is expected fro the first quarter of 2019. This is a little earlier than the WSJ consensus, but It also seems in line with the slow down predicted in GDP. 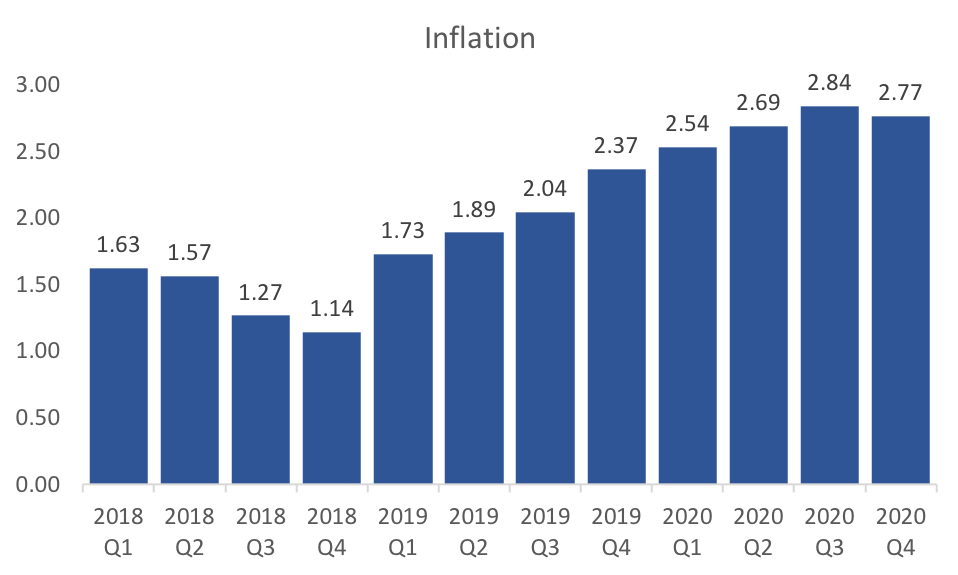 The forecasts for inflation are a little more surprising. The model predicts low inflation (relative to the Fed's target of 2%) for 2018. If I remove the federal funds rate expectations from the professional forecasters then this drop off in 2018 disappears. Therefore, the impact seem all related to the planned monetary tightening by the Fed.
I plan to make many improvements to this forecasting model, but would be interested in your thoughts... The Fed raised rates recently keeping their promise of raising the rate in the face of positive economic data. The WSJ forecasts corroborate this rosy picture of the future economy and improving their forecasts from last month.
The consensus GDP growth forecast for the coming four quarters rose by a tenth of a percent or more, and all future unemployment numbers went down. It also looks like the forecast for the turning point in unemployment is being pushed out until mid 2019. The consensus probability of a recession in the next 12 months dropped half a percent to 14.1 percent. Some of the details however do not indicate the same degree of certainty in the future economic position. The expected gap between the federal funds rate at ten year bonds continues to tighten signaling a flattening yield curve, which means the Fed may struggle normalize long rates in time for the next recession. Expected housing starts and housing prices dipped a little, but not enough to be overly concerning. Of course it is no surprise given political turmoil in Saudi Arabia, OPEC extension of production cuts, and now the North Sea pipeline problems, that expected oil prices increased significantly. Expected prices increased by 2 dollars or more through 2018. All in all, there is a strong belief amongst the Fed and professional forecasters that board scope economic futures look robust, but there are still some potential weaknesses. The new WSJ forecasts were released last Friday and it looks as if the recent data has caused the forecasters to be pessimistic about the short-term, but optimistic about the long-term. Forecasts for inflation and unemployment through 2018 worsened (unemployment ticked up, while inflation decreased), but consensus predictions for for both variables in 2019 improved. In addition, only the last two quarters of 2017 GDP growth were revised downward, and all subsequent quarters and annual projections rose. These general macroeconomic indicator forecasts were somewhat at odds with the changes in specific indicators like the ten-year bond rates and crude oil prices. Bond rates were all revised downward, despite increases of the expected federal funds rate in 2019. Crude oil prices are still expected to rise slowly over the next two years, but only reaching the low 52 dollar mark, instead of 53 or 54 from a couple of months ago. Despite the lackluster September employment report, payroll forecasts for next year rose by over 10,000 to 16,080. These numbers suggest that the recent data implies that the economy is sliding a little below the long-run growth path. As I pointed out while discussing the recent payroll report, long-run time-series dynamics seem to be dominating current forecasting (as opposed to structural modeling and forecasting). I believe these recent round of forecasts supports that idea, because this pattern of revision is consistent with the behavior we observe. To see what I mean look at Crude Oil Price forecasts: 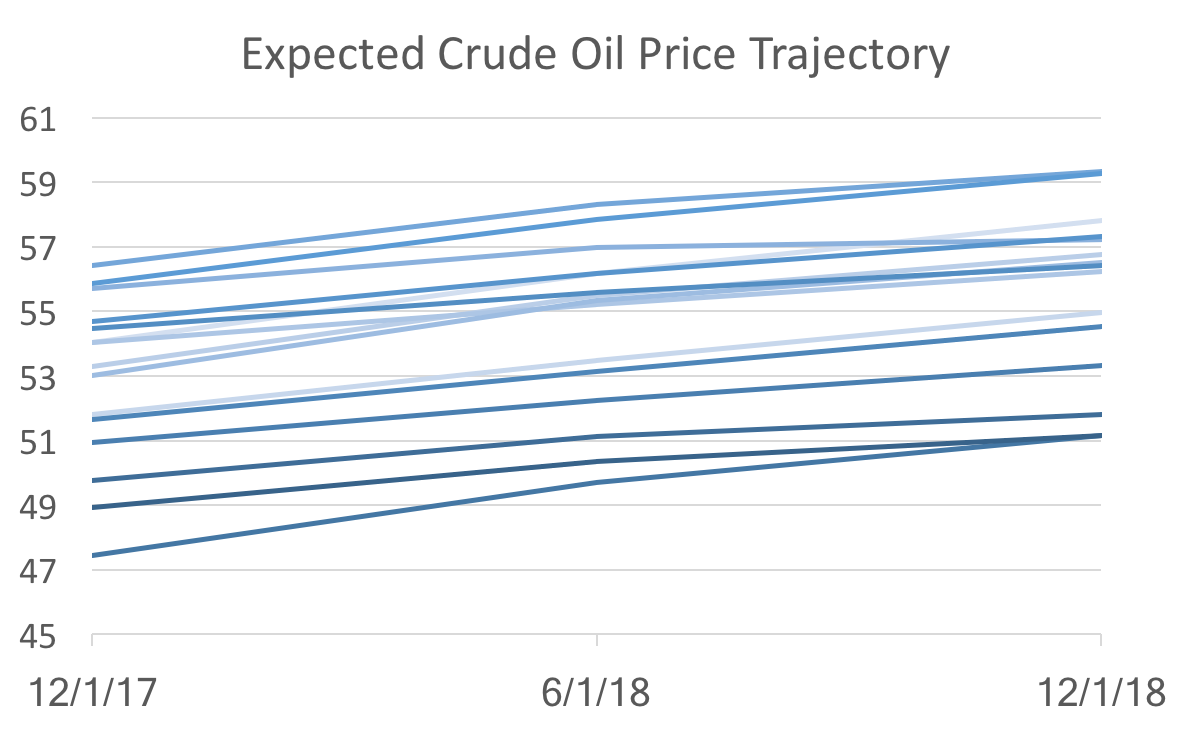 The graph above shows forecasts at different points in time (light to dark indicates old to new). All we see are level shifts (the intercept) holding the dynamics (the slope) the same. That suggest the new data are not changing anything about the fundamentals, which would alter the trajectory, but instead only reveal changes in the starting point of a more or less unchanged dynamic system.
But is that good news or bad news? The good news: there really isn't any bad fundamental news. The bad news: models based on dynamic systems are correct on average, but since they are essentially data driven, it makes forecasters appear to be agreeing with each other. So the recent drop in forecast uncertainty (defined as the standard deviation amongst forecasters), does not necessarily indicate that we know a lot about where the economy is heading. Following up on Monday's post about the employment report, today's post will look at the most recent employment data using Hamilton's filtering method. The commenters on the Federal Reserve (see Tim Duy or Narayana Kocherlakota) have noted the uncertainty surrounding employment and inflation. Kocherlakota specifically sees weakness in employment and downplays inflation worries. Tim Duy is less prescriptive, but also notes the uncertainty. The graphs below demonstrate where this uncertainty is coming from. Employment and weekly hours appear to be at their trend, or falling slightly below (not good), but initial jobless claims and unemployment are well below their trend (good). The most telling sign is the continued drop off in weekly hours, which could mean that employers have worked through the "slack" in the economy. The graph of real wages below corroborates that story: 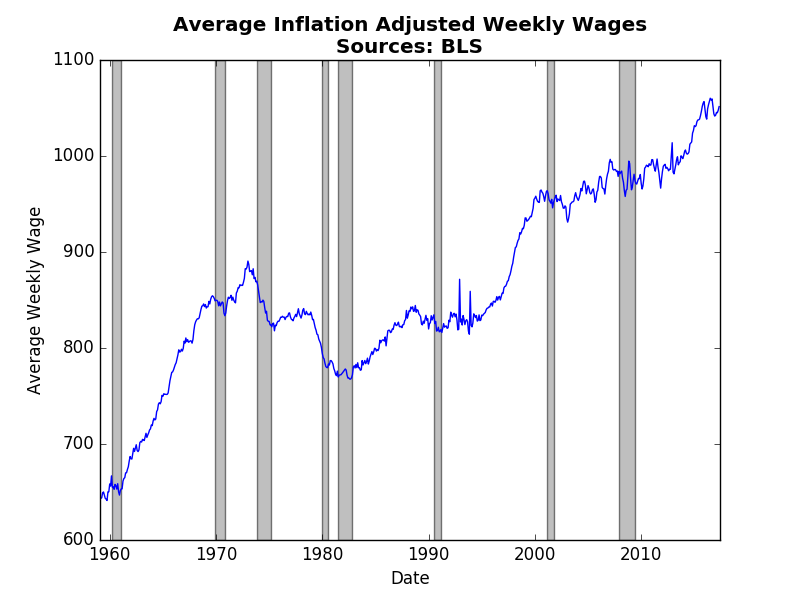 From 2013-2015 real wages finally started to rise as weekly hours fell and the job market tightened. However, recent wage reports have indicated a return to stagnant real wages (meaning wages are only just keeping up with inflation). Real wages climb when employees have bargaining power, which happens when fewer qualified people apply for the same jobs. Despite a healthy June jobs report, the likelihood of sustained jobs growth seems to be dimming with each month.
This post examines the WSJ Survey specifically looking at forecasts of the unemployment rate. Compared to previous posts on GDP, Fed Funds Rate, and Economic Risk, forecasters have high expectations for the future unemployment rate. In particular, they have become increasingly optimistic about 2018 relative to 2017. The graph below depicts the average forecasted unemployment rate for each month since December 2015 across June and December in 2017 and 2018. The lines become darker the closer the forecast is to the present. 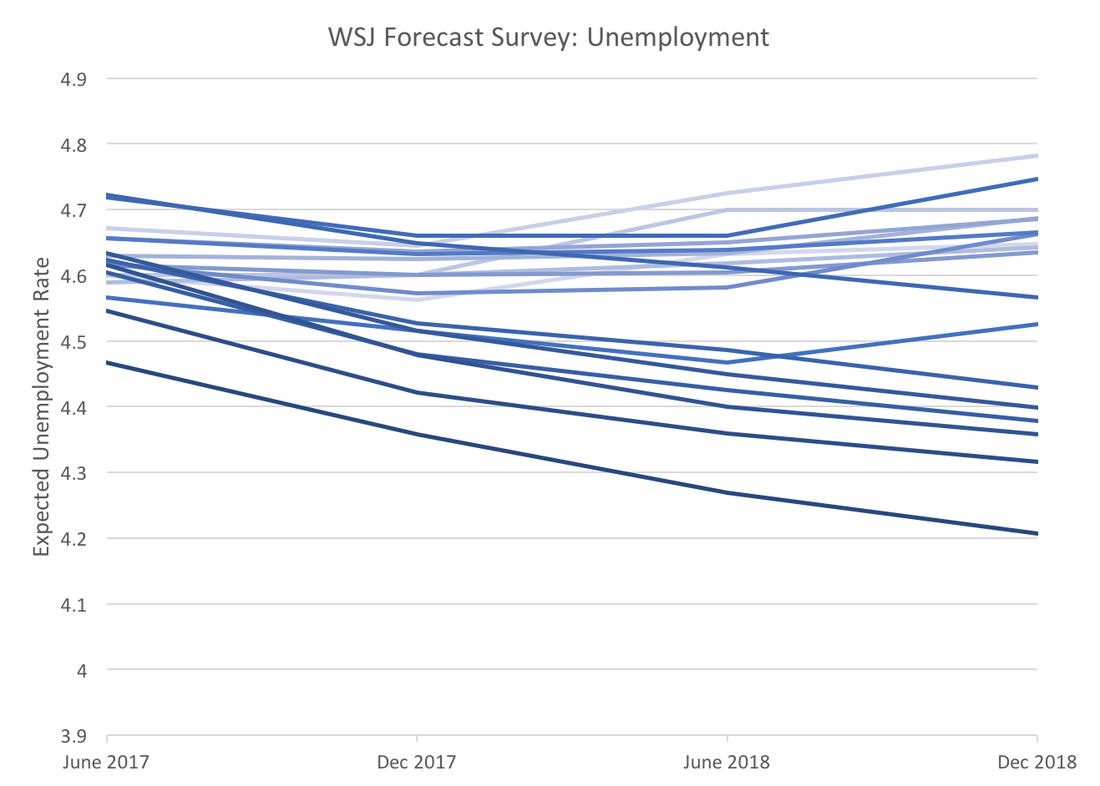 Forecasters are not just becoming optimistic about short-term unemployment, but they are also expecting the trend to continue for a year and a half. A year ago they were expecting the end of 2017 to be the low point in the unemployment rate. The current consensus forecast for December 2018 is 4.21 percent, a rate not seen since prior to the Dot Com bubble, however given the recent unemployment numbers (4.3%) this expectation seems plausible.
The upbeat unemployment forecasts put the more tepid GDP and interest rate forecasts in perspective. More than likely the most recent revisions are an overreaction to the strong April payroll employment numbers. The more recent May payroll and unemployment values send a more mixed message more consistent with previous GDP and interest rate forecasts. |
Archives
May 2018
Categories
All
|