
 RSS Feed
|
Many of my posts have focused on the WSJ economic forecasting survey. However, I have decided to include my own projections of the US economy. For now I will focus on headline economic data, namely Real GDP, Inflation, and Unemployment, but I plan to add more macroeconomic indicators as I develop more models. The unique aspect of my forecasting methodology is grouping some data series into few sectors (financial, manufacturing, housing, and labor) and including the aggregate measures of expectations I have previously discussed. Please see those previous posts for the methodology behind the aggregate expectations. The sector data uses the cyclical components of several data series within a sector. For example, in the labor market sector I use payroll employment, initial claims, weekly hours, and mean unemployment duration. After generating those cycles I feed them through a dynamic factor model and extract a latent factor series, which I consider markers of broader cycle within the sector. The graph below shows those latent factors: 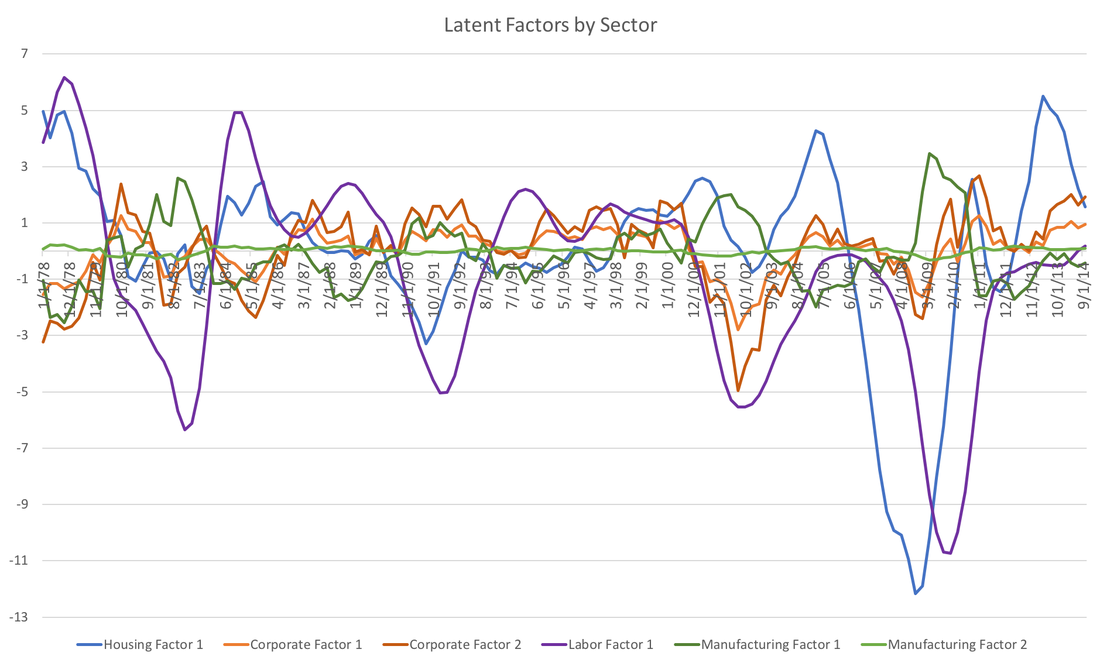 Combining those latent factors of those four sectors with aggregated expectations of inflation, real GDP, and the Federal Funds Rate, we run VARMA(4,0) and forecast 12 quarters out. The bar graph below presents the results for real GDP: 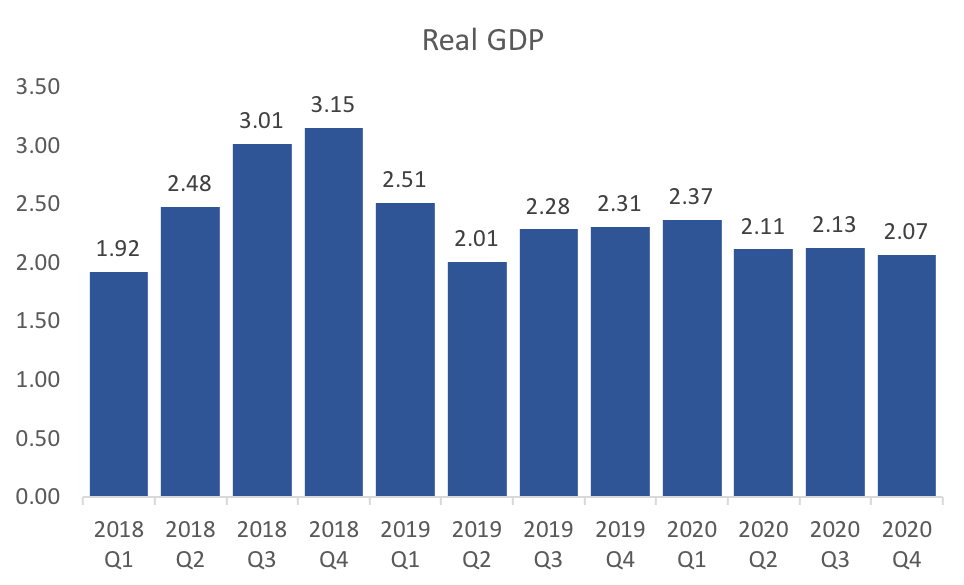 The model is optimistic about the second half of 2018. On the whole 2018 looks to be a quite robust year with 2019 showing signs of returning to the average long run growth rate. 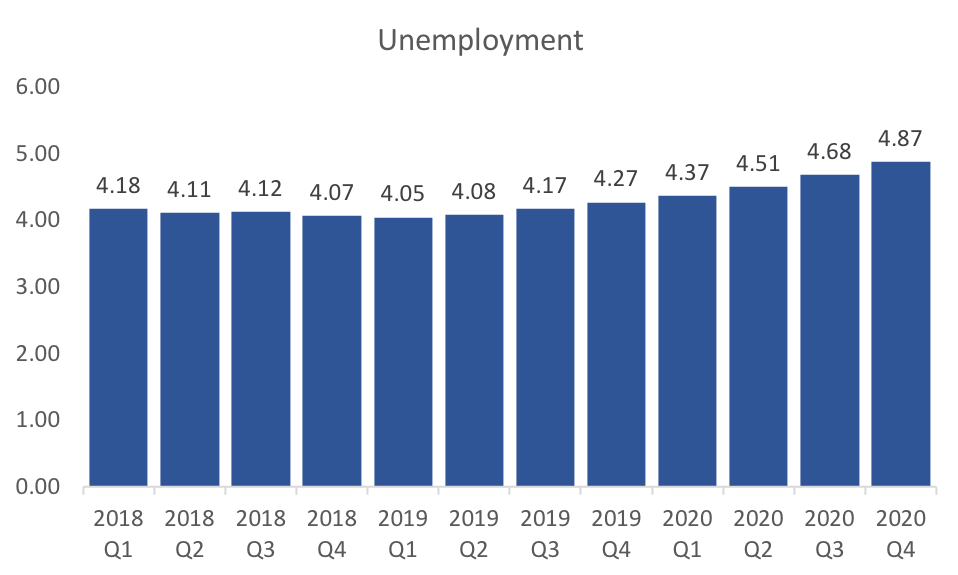 Turning to unemployment, the model is off a little on the level of unemployment, but I suspect that the dynamics are more or less a good prediction. The trough in unemployment is expected fro the first quarter of 2019. This is a little earlier than the WSJ consensus, but It also seems in line with the slow down predicted in GDP. 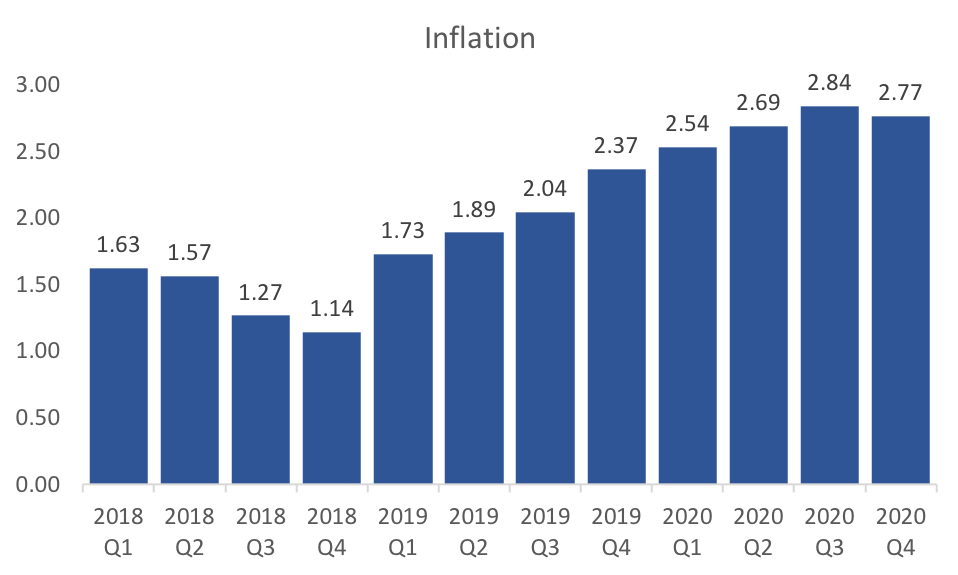 The forecasts for inflation are a little more surprising. The model predicts low inflation (relative to the Fed's target of 2%) for 2018. If I remove the federal funds rate expectations from the professional forecasters then this drop off in 2018 disappears. Therefore, the impact seem all related to the planned monetary tightening by the Fed.
I plan to make many improvements to this forecasting model, but would be interested in your thoughts...
0 Comments
Time again to visit WSJ Economic Forecasts. There was a great jobs report last week and other economic data seem to support a strong medium-run economy in the views of the professional forecasters. The only major downside was a sharp decrease in the forecast of first quarter GDP in 2018 which dropped by a third of a percent to 2.52 percent.
The unemployment rate, which fell below 4 percent with the trough in mid 2019, saw the most optimist changes. This was undoubtedly tied to the jump in payrolls forecasts, which rose by about 20,000 to nearly 200,000 new jobs per month over the next year. The strong jobs report last week drove both of these changes. Most other variables moved only slightly. Inflation expectations changed marginally, but mostly converged in the direction of the 2% Federal Reserve target. Crude oil price forecasts also fell modestly. Housing market expectations for this year and next were mostly unchanged. The consensus recession probability indicator fell slightly to 13.6 percent. Finally, we turn to the yield curve spread (the difference between the ten year bond and the federal funds rate) as we have in previous posts. We have an interesting development as short run forecasts through the end of the year see a riding yield curve spread, indicating a steeper yield curve, and the longer horizon (2020) showed a flatter yield curve. This suggests that forecasters are wary of an impending recession in the longer run. |
Archives
May 2018
Categories
All
|