
 RSS Feed
|
I have started a new project with the goal of generating several series that aggregate expectations of macroeconomic variables. This post describes the inflation expectations series. Below I have plotted the results relative to actual year-over-year CPI inflation. 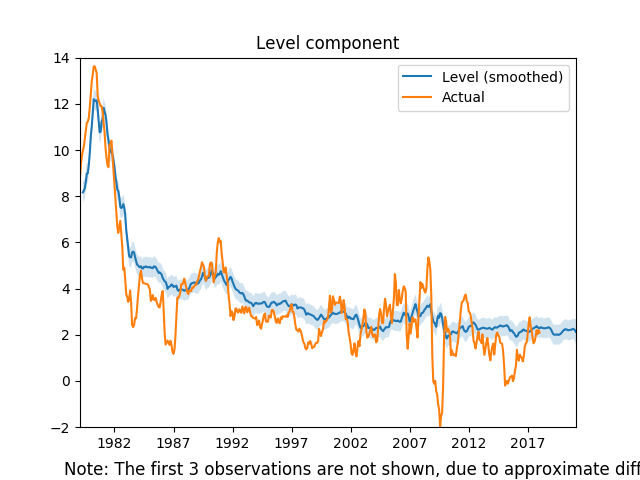 This series combines six different inflation expectations series: Federal Reserve Greenbook forecasts, Survey of Professional Forecasters, NY Fed Survey of Consumer Expectations, WSJ Survey, Cleveland Fed Inflation Expectations, and the Michigan Survey of Consumers. There are typically multiple forecasts for any given month over many horizons. To construct the series I create an average weighted by the inverse of the forecast horizon. Then in order to strip away some of the seasonal shocks I pass the resulting data through and unobserved components model. Here is the raw expectations data: 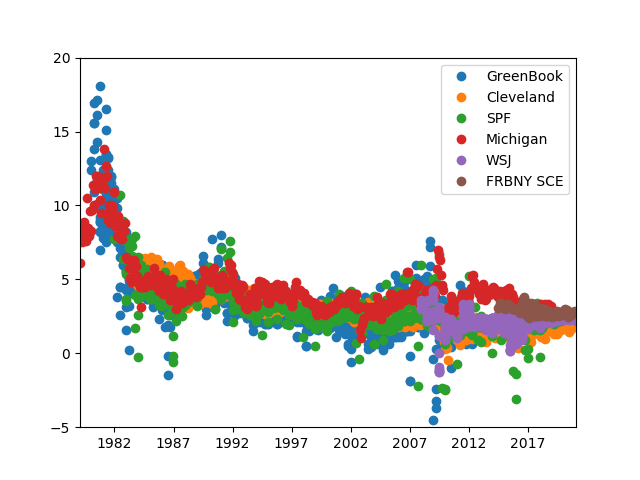 We can see that only the last few years of the series incorporate the NY Fed and the WSJ forecasts, and the Greenbook survey has a 6 year lag. As such the most interesting part of this new measure is the last several years of data: 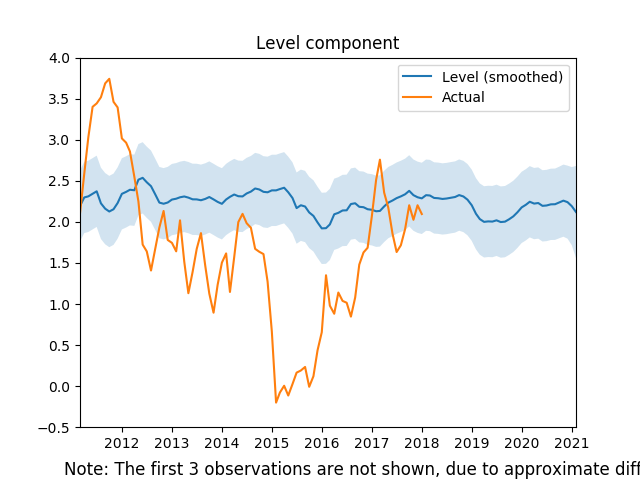 While the low inflation in 2015 did impact expectations (with a lag) the broad trend shows that inflation expectations are quite stable and slightly above 2 percent. This is good news for the Fed, but this series is influenced by Fed forecasts, so I dropped both the Greenbook and the Cleveland Fed forecasts in the graph below: 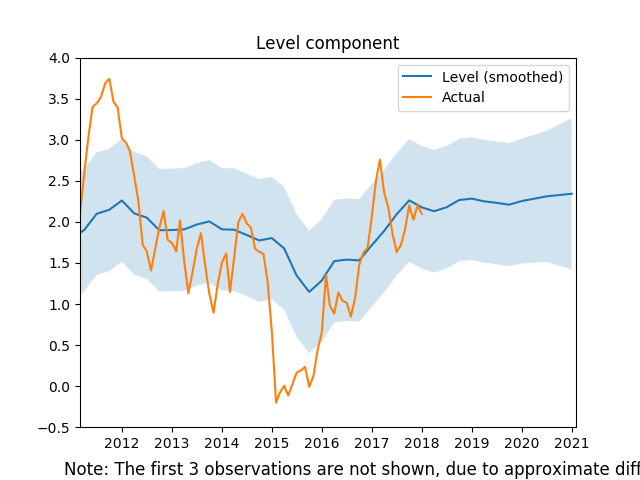 Interestingly, there is an even larger impact due to the 2015 drop in inflation, and it appears as if consumers and professional forecasters actually have lower inflation expectations in general.
While these graphs are useful, the methodology used in constructing the aggregated inflation expectations necessarily lost a lot of information. In the future, I would like to not only have the series for each month, but also the forecasts over the preceding 3 year horizon. With that information we could not only see what was happening to expectations, but also how those expectations of a particular point in time were evolving. Please let me know your thoughts...
0 Comments
Leave a Reply. |
Archives
May 2018
Categories
All
|