
 RSS Feed
|
Recently the WSJ made the May economic forecasts available on their website. In replicating the previous analysis it became clear that the results were influenced by the selected sample. The proper comparison, requires that all values are calculated using the same group of forecasters. The table below reanalyzes data of the 37 forecasters that provide forecasts for Q1, Q2, Q3, Q4, and the full year of 2017. It includes the May forecasts. 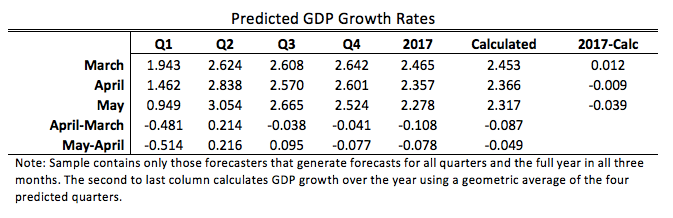 Forecasters have become increasingly pessimistic about annual growth, while remaining more optimistic about individual quarters. Their predicted annual growth rates have fallen 0.186 percentage points, whereas growth rates calculated using a geometric average of predicted quarterly rates have fallen 0.126 percentage points. As a consequence, calculated annual growth went from being higher than reported annual growth to being lower.
Solid predicted growth in Q2 outweighed the lackluster economic performance of the first quarter. The significant drop in the first quarter reflects the advanced estimate of GDP reported by the BEA in April.
1 Comment
|
Archives
May 2018
Categories
All
|