
 RSS Feed
|
The Wall Street Journal economic forecast for June has been released. The first post of the June series will take a more in-depth look at the GDP forecasts. Previous posts (see here and here) looked at how consistently participants annual forecasts matched their intermediate quarterly forecasts. Alternatively, we could consider the influence of those quarterly forecasts had on the annual forecasts using a basic regression. The table below explores what quarterly forecast information had the greatest impact on annual forecasts. The sample of 49 analysts provided growth rates for all quarters and full year in both May and June (see the end of the post for some technical details). 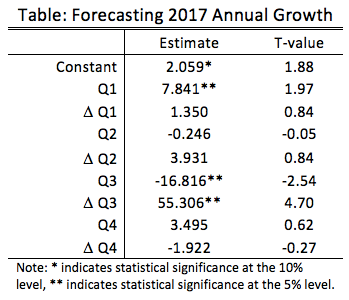 The results suggest that analysts with first quarter forecasts that were 1 percent above the mean tended to increase their annual growth forecasts by 7 hundredths of a percent more than the average. Basically those who are optimistic about the beginning of the year are optimistic for the whole year.
However, a more subtle result arises from the third quarter estimates and revisions. First, being optimistic about the level of third quarter growth was correlated with downward revisions of annual growth. Second, becoming more optimistic about third quarter growth was correlated with upward revisions of annual growth. A likely story that explains these facts is that revisions in third quarter growth are largely driving revisions in annual growth, but that those who are most optimistic about third quarter growth have somewhat muted expectations about annual growth. Forecasters project a 2.27 percent annual growth rate for the whole year and 1.20, 2.98, 2.57 and 2.47 percent for Q1, Q2, Q3 and Q4, respectively. Even though first quarter growth is still expected to be slow, forecasters anticipate that the subsequent quarters will be robust. The analysis above suggests that a critical component to changing expectations are optimism about third quarter growth and third quarter revisions. Technical Notes: The data for the levels are percent deviations from the mean. The data for the revisions are the percentage change from May to June. The regression utilizes standard Ordinary Least Squares, which means it does not account for endogeniety (quarterly and annual forecasts are created at the same time by the forecasters), therefore we cannot say anything about causality using this technique.
0 Comments
Leave a Reply. |
Archives
May 2018
Categories
All
|