
 RSS Feed
|
This innaugural post on the Wall Street Journal's Economic Forecasting Survey focuses on GDP forecasts. Future posts will examine other forecasted variables and discuss the major factors influencing those forecasts. The monthly survey asks over 50 financial and economic analysts for forecasts of multiple variables over multiple forecasting horizons. Forecasters are asked to provide estimates of Real GDP growth for the upcoming 4-5 quarters and 3-4 years. Since initial announcements of GDP are estimates the survey asks about quarters that have already passed. For example, in the April 2017 survey analysts were asked to offer expectations about first quarter GDP. The official "advance" estimate was announced by the BEA on April 28. This date is after forecasters submitted their forecasts to the WSJ. The advance estimate from the BEA came in at 0.7 percent, well below the forecasters consensus estimate of 1.4 percent. Forecasters may not be far off the actual numbers which will be anounced in several months. In general, the advanced numbers are revised by about half a percentage point (on average), which means the analysts were within a reasonable margin of error (the standard deviation for their forecasts was 0.48). What may be more revealing is digging into the revisions that the analysts themselves make from month to month. Below is a table of the consensus estimates and their change from March and April for all four quarters of 2017, as well as the annual growth for all of 2017. 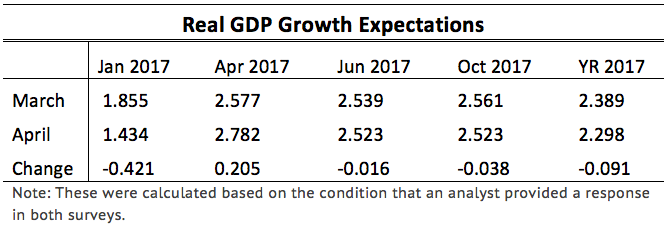 We see that the analysts made downward revisions (not one analyst increased their projection) of Q1 GDP, but increased Q2 GDP. The net effect was a slight drop in projected annual GDP growth. While the March and April numbers appear unchanged, they also fell slightly, but not enough to significantly impact annual growth.
That cohesive story breaks down a bit when one calculates the implied annual growth given by the quraterly growth rates. The consensus growth for 2017 in March was 2.37 percent while in April it increased to 2.53 percent for an average change of 0.151 percentage points. This suggests that analysts form forecasts over different time scales independently. That is, the forecast they make about annual GDP uses different information than the forecasts of each quarter leading to that total annual GDP. One way to interpret that is that the analysts see downside risk over the entire year of 2017, but are unsure in which quarter the shock will hit. Based on these forecasting revisions it seems that the most uncertainty resides in the second half of the year.
0 Comments
Leave a Reply. |
Archives
May 2018
Categories
All
|