
 RSS Feed
|
The recent release of second quarter GDP growth came in below WSJ expectations as well as a downward revision of first quarter growth (from 1.4 to 1.2). This new data follows weak inflation numbers from last week. 1. For the past two years expectations exhibit an upward bias. Which, if that bias holds true, means low future expected growth would indicate even lower actual growth. Projected growth in 2018 is 2.38 percent, and 1.94 percent in 2019. These are significantly below the administrations overly optimistic 3 percent promise. 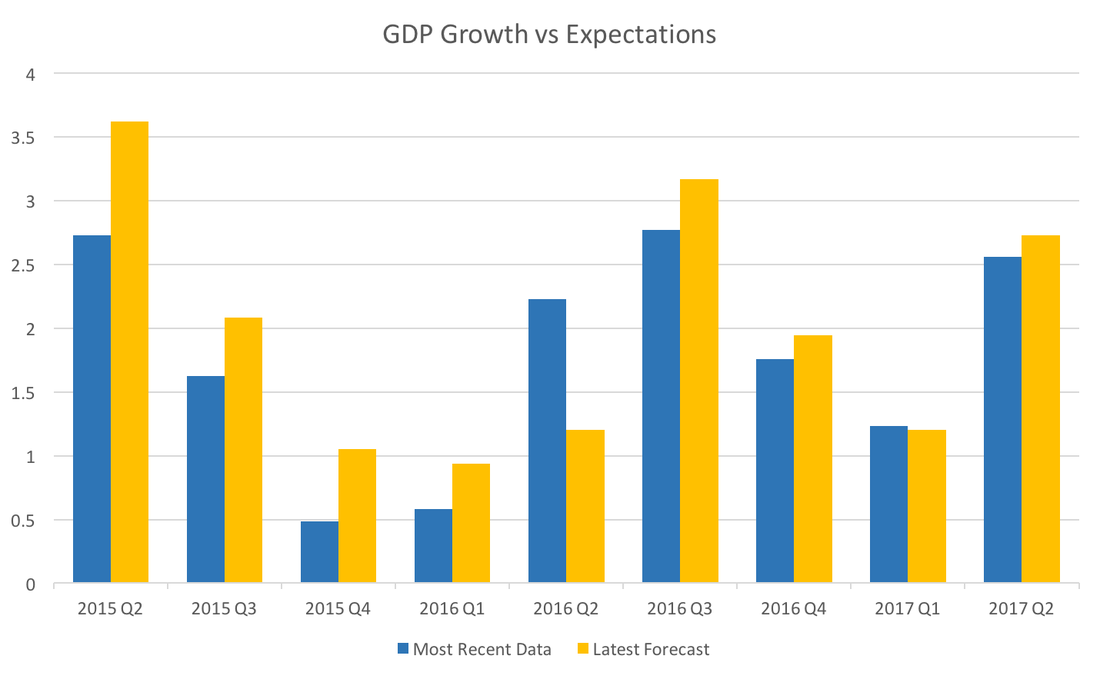 2. Expected federal funds rates have been falling since the beginning of the year. Not by a lot, but it has been consistent, suggesting that new data will give the Fed pause in increasing their target rates. 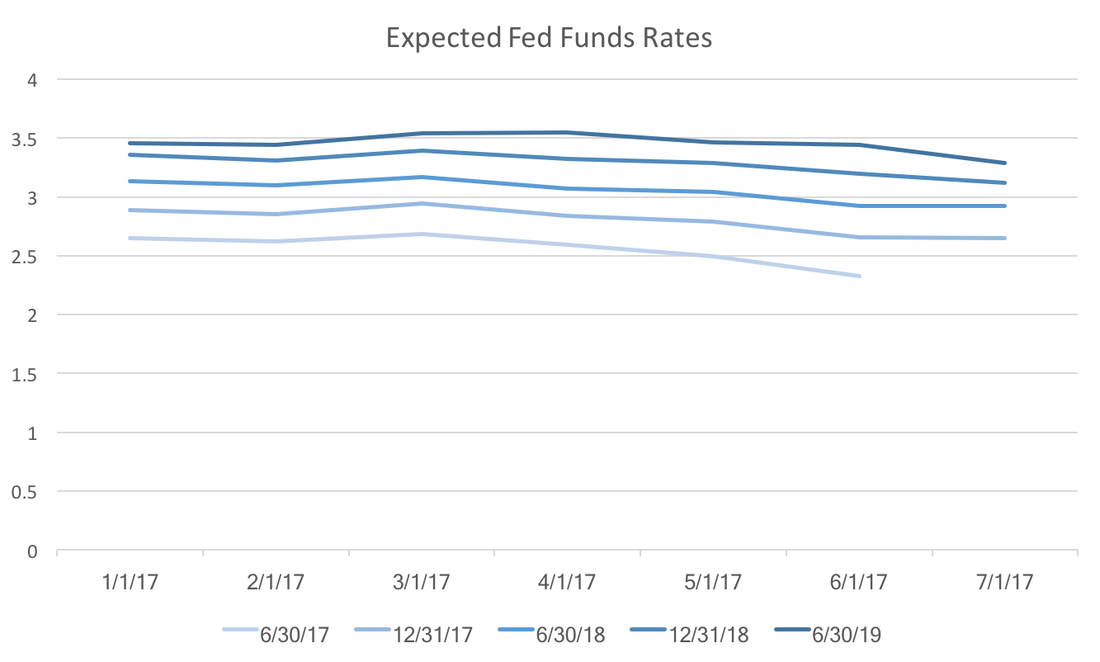 3. Expected housing starts continue to fall. At the beginning of 2016 expected housing starts were quite robust, however, subsequent data have curtailed consensus optimism. If this expectation falls below 1200, that could be a signal the beginnings of a slow down in the housing market. 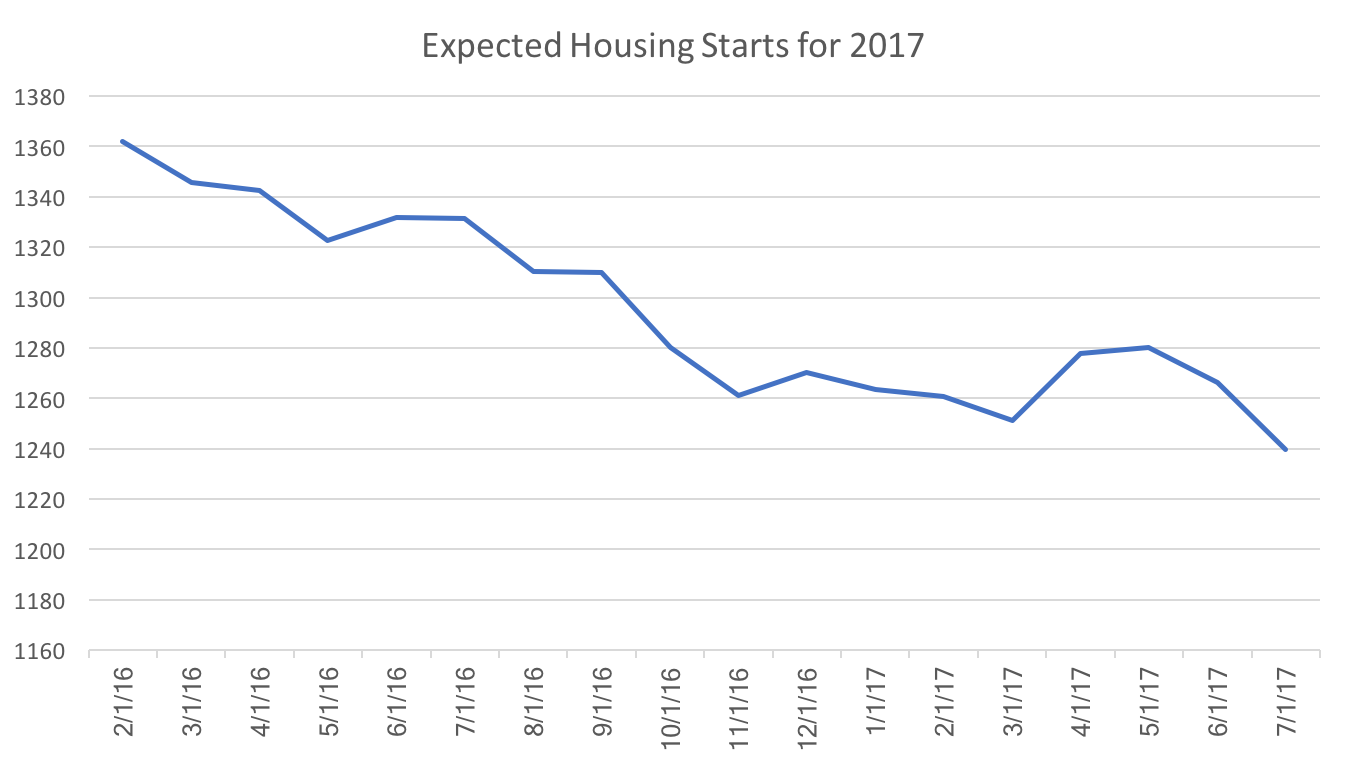 While there some signs of growth remain, these three sets of expectations should worry investors and the current administration. All indicate at the very least, that the economy will not grow particularly quickly in the coming year. In the worst case scenario we may see the beginnings of a recession by the end of 2018.
0 Comments
WSJ Economic Forecast participants report the probability of a recession within the next 12 months. The consensus of the June survey participants has that probability at 16 percent. It appears that Q3 GDP growth appears to play a critical role in forecasters recession probabilities. The table below reports the results of a simple regression. 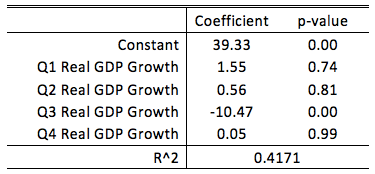 A forecaster who predict zero GDP growth in Q3 would place, on average, a 40 percent probability on the chance of a recession in the next 12 months. For every one percent increase in predicted Q3 GDP growth, that average recession probability would decrease by 10 percentage points. The other quarters do not appear to have a statistical relationship with recession probabilities.
Taken altogether, while a recession does not appear likely to these forecasters, the third quarter plays a pivotal role in these forecasts. The current consensus is 2.6% growth in the third quarter, only slightly below Q2 expectations. If we see weakness leading into the third quarter, we can expect forecasters to start increasing the probability of a recession. Hillary Clinton stated in a recent interview that misogyny contributed to her loss in the 2016 election. No doubt that some voters cast votes based on gender (in both for and against Clinton), but those voters (and votes) decided long before the election season started. Many claim that Bernie Sanders and Donald Trump tapped into working class anger over inequality. However as Nate Silver has pointed out on numerous occasion (here and here just to mention a few), GDP growth has some explanatory power in predicting elections. Specifically, low or negative GDP growth tends to hurt the chances of the incumbent party. This post dissects the claims of inequality and headline economic growth. 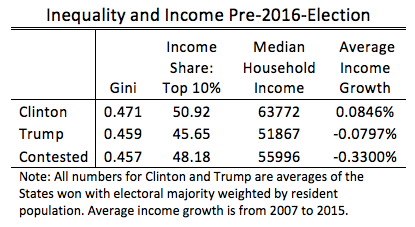 The table above provides statistics of states in which the majority of voters voted for Clinton or Trump and those states where neither received the majority. For inequality we have data on the Gini coefficient within each state in 2010 and the share of income commanded by the top 10 percent within each state in 2013. The Gini coefficient measures the degree of inequality on a scale from 0 (least unequal) to 1 (most unequal). Clearly by both measures, within-state inequality was worse for states that overwhelmingly voted for Clinton.
Hosehold median income arguably shows the inequality story as a national phenomenon, but those statistics were qualitatively the same at the time of Barack Obama's re-election in 2012. However, when we turn to the average growth rate of median household income over Obama's tenure (2007-2015) we see a striking disparity between the states where the majority voted for Clinton and the rest. The solid Clinton states fully recovered from the recession and have even surpassed pre-crisis income levels. In contrast, the solid Trump States have not. In the contested state, the "incumbent" democrats faced strong headwinds from the slow growing economy. What have we learned? Local inequality does not seem to be driving election results, however, the lack of economic recovery in states that either voted for Trump or were narrow contests surely influenced the election. A suggestion for future elections would be to consider the long-term economic growth within a state as opposed to the entire nation over the term of the incumbent. Notes: Gini data comes from the US Census Bureau. Income share data comes from Mark Frank. Household income data comes from the GeoFred database. The Trump administration has plans to cut taxes. There have been other blogs and articles that have explained that tax cuts do not necessarily increase growth (see Dietrich Volrath, and Brookings for example). Most of these consider only US economic history, which may be idiosyncratic. Instead, this post will look at recent economic tax policy and economic performance of several OECD countries from 2000 to the present (the data can be found on stats.oecd.org). 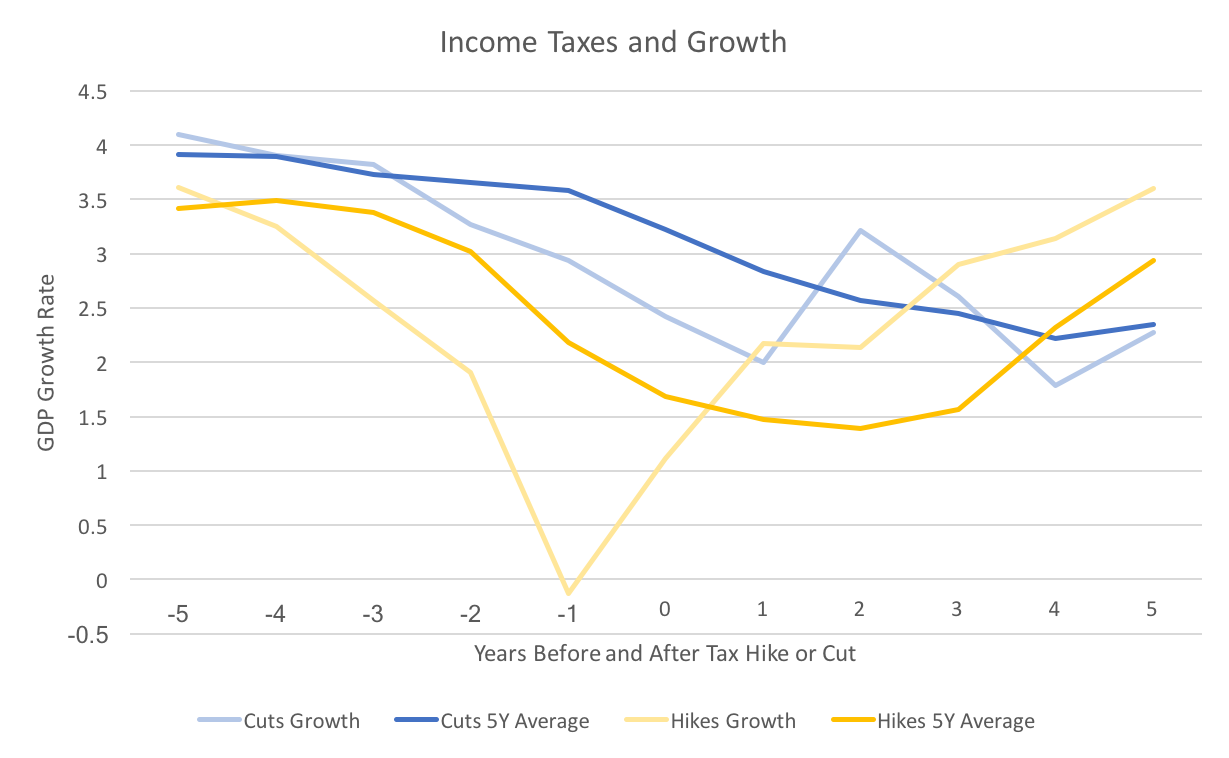 The graph above depicts the average growth rate before and after a tax policy change. The blue lines represent tax cuts and the yellow lines, tax hikes. The darker lines averages the five year average (annualized) growth rate within each country, and the lighter lines average the one year growth rate. The results confirm what has been found in most research, tax cuts have little impact on growth, and tax hikes can lead to higher growth in the long run.
The figure does a nice job of showing this, but numbers may also put it in perspective. The difference between the five year average before and after a tax cut is -0.877 percentage points. For a tax hike the similar number is 1.256 percentage points. In other words the five years after a tax cut have almost 1 percentage points lower GDP than the five years prior, whereas the years after a tax hike have a 1.25 percentage point increase. Some caveats to this analysis: 1) One might think that a tax cut follows the start of a recession. In this case 4 out of the 15 hikes and 9 of the 37 cuts occurred in 2008 through 2011. Roughly the same percent. 2) Deciding whether there was a tax hike or cut depended upon a change in the marginal income tax rates. Sometimes tax reforms changed both the margins and the rates, making it unclear whether there was a cut or a hike. Those cases were ignored. 3) Finally, the analysis above is crude and one dimensional. It is possible that countries that tend to cut taxes rather than raise them have other characteristics that lead to lower growth. Even with those caveats in mind, the evidence seems pretty clear. The lower tax rates will not be offset by higher economic growth, certainly not to the extent predicted by the administration or Congressional republicans. Recently the WSJ made the May economic forecasts available on their website. In replicating the previous analysis it became clear that the results were influenced by the selected sample. The proper comparison, requires that all values are calculated using the same group of forecasters. The table below reanalyzes data of the 37 forecasters that provide forecasts for Q1, Q2, Q3, Q4, and the full year of 2017. It includes the May forecasts. 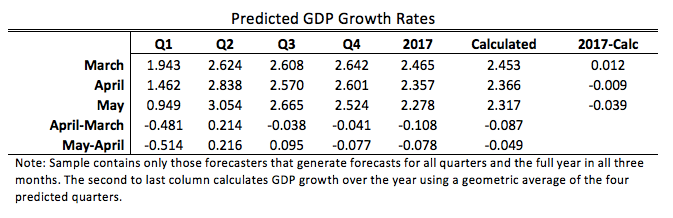 Forecasters have become increasingly pessimistic about annual growth, while remaining more optimistic about individual quarters. Their predicted annual growth rates have fallen 0.186 percentage points, whereas growth rates calculated using a geometric average of predicted quarterly rates have fallen 0.126 percentage points. As a consequence, calculated annual growth went from being higher than reported annual growth to being lower.
Solid predicted growth in Q2 outweighed the lackluster economic performance of the first quarter. The significant drop in the first quarter reflects the advanced estimate of GDP reported by the BEA in April. This innaugural post on the Wall Street Journal's Economic Forecasting Survey focuses on GDP forecasts. Future posts will examine other forecasted variables and discuss the major factors influencing those forecasts. The monthly survey asks over 50 financial and economic analysts for forecasts of multiple variables over multiple forecasting horizons. Forecasters are asked to provide estimates of Real GDP growth for the upcoming 4-5 quarters and 3-4 years. Since initial announcements of GDP are estimates the survey asks about quarters that have already passed. For example, in the April 2017 survey analysts were asked to offer expectations about first quarter GDP. The official "advance" estimate was announced by the BEA on April 28. This date is after forecasters submitted their forecasts to the WSJ. The advance estimate from the BEA came in at 0.7 percent, well below the forecasters consensus estimate of 1.4 percent. Forecasters may not be far off the actual numbers which will be anounced in several months. In general, the advanced numbers are revised by about half a percentage point (on average), which means the analysts were within a reasonable margin of error (the standard deviation for their forecasts was 0.48). What may be more revealing is digging into the revisions that the analysts themselves make from month to month. Below is a table of the consensus estimates and their change from March and April for all four quarters of 2017, as well as the annual growth for all of 2017. 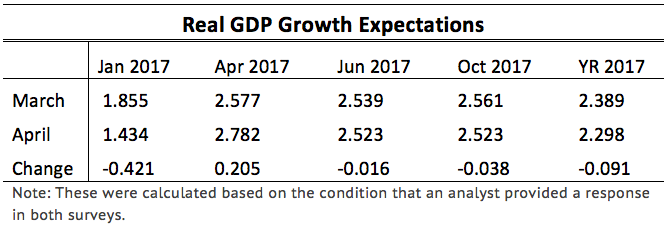 We see that the analysts made downward revisions (not one analyst increased their projection) of Q1 GDP, but increased Q2 GDP. The net effect was a slight drop in projected annual GDP growth. While the March and April numbers appear unchanged, they also fell slightly, but not enough to significantly impact annual growth.
That cohesive story breaks down a bit when one calculates the implied annual growth given by the quraterly growth rates. The consensus growth for 2017 in March was 2.37 percent while in April it increased to 2.53 percent for an average change of 0.151 percentage points. This suggests that analysts form forecasts over different time scales independently. That is, the forecast they make about annual GDP uses different information than the forecasts of each quarter leading to that total annual GDP. One way to interpret that is that the analysts see downside risk over the entire year of 2017, but are unsure in which quarter the shock will hit. Based on these forecasting revisions it seems that the most uncertainty resides in the second half of the year. |
Archives
May 2018
Categories
All
|