RSS Feed
|
The February WSJ forecasts are in and, in general, we are seeing good news. First off, 2018 Q1 expected GDP growth is up a quarter percent to 2.6 and the expected unemployment rates through 2020 all fell. The trough of unemployment is still hovering around mid 2019. Expected payrolls forecast rose by almost 8400, strengthened by the robust January employment report.
Inflation expectations increased again, standing firmly above 2 percent. Expected housing starts are more or less unchanged, but housing price forecasts for 2018 and 2019 both rose a tenth of a percent. We also saw a huge increase in crude oil expectations as almost all future prices rose by more than 2 dollars, with price expectations above 60 dollars for the next two years. Finally, consensus recession expectations rose, but still remain low, with less than a 14 percent chance of a recession in the coming 12 months. As I have noted in previous reports, December and January Reports, the spread between the expected future federal funds rate and the ten-year bond rate has been tightening. This month, ten-year bond rate forecast all rose by over a tenth of a percent, whereas consensus expected Federal funds rate increases were more modest. This is good news for monetary policy makers, because they will be able to use the long end of the yield curve when the next recession begins. However, in the short term, particularly given the recent sell off of stocks, this presents a potential head wind against our waning economic recovery.
0 Comments
I have started a new project with the goal of generating several series that aggregate expectations of macroeconomic variables. This post describes the inflation expectations series. Below I have plotted the results relative to actual year-over-year CPI inflation. 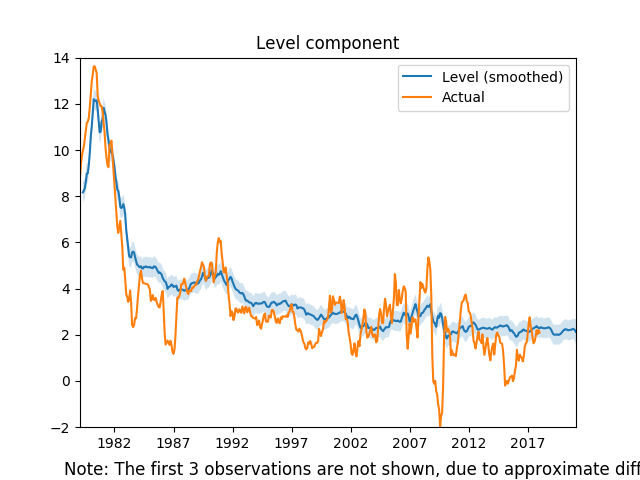 This series combines six different inflation expectations series: Federal Reserve Greenbook forecasts, Survey of Professional Forecasters, NY Fed Survey of Consumer Expectations, WSJ Survey, Cleveland Fed Inflation Expectations, and the Michigan Survey of Consumers. There are typically multiple forecasts for any given month over many horizons. To construct the series I create an average weighted by the inverse of the forecast horizon. Then in order to strip away some of the seasonal shocks I pass the resulting data through and unobserved components model. Here is the raw expectations data: 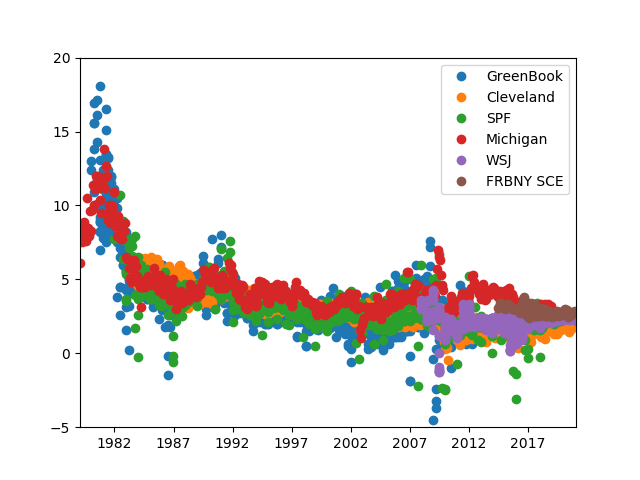 We can see that only the last few years of the series incorporate the NY Fed and the WSJ forecasts, and the Greenbook survey has a 6 year lag. As such the most interesting part of this new measure is the last several years of data: 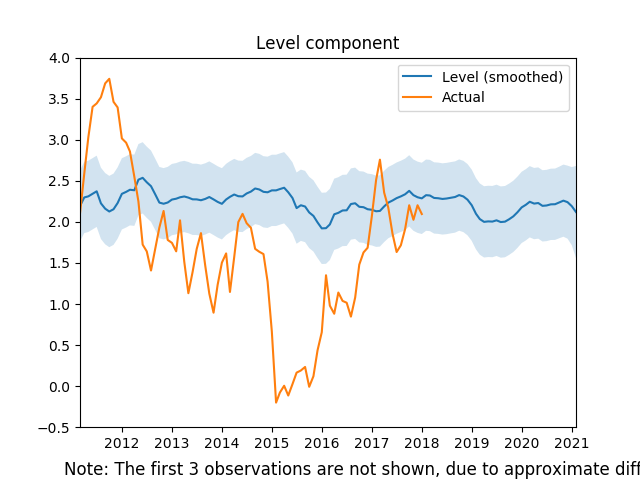 While the low inflation in 2015 did impact expectations (with a lag) the broad trend shows that inflation expectations are quite stable and slightly above 2 percent. This is good news for the Fed, but this series is influenced by Fed forecasts, so I dropped both the Greenbook and the Cleveland Fed forecasts in the graph below: 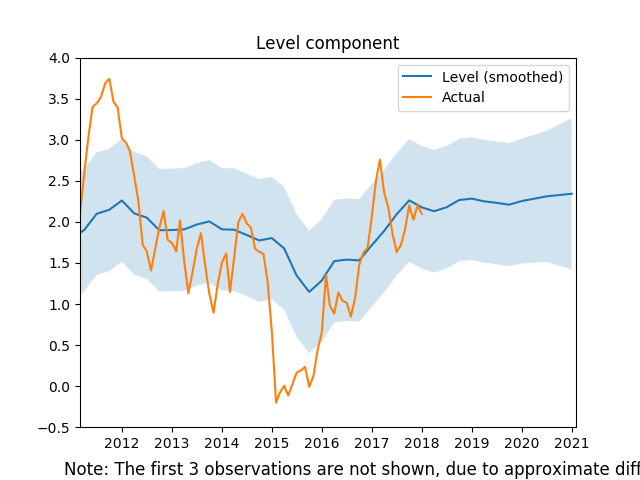 Interestingly, there is an even larger impact due to the 2015 drop in inflation, and it appears as if consumers and professional forecasters actually have lower inflation expectations in general.
While these graphs are useful, the methodology used in constructing the aggregated inflation expectations necessarily lost a lot of information. In the future, I would like to not only have the series for each month, but also the forecasts over the preceding 3 year horizon. With that information we could not only see what was happening to expectations, but also how those expectations of a particular point in time were evolving. Please let me know your thoughts... In general, we observe WSJ forecasters responding to favorable economic data. Consensus GDP forecasts through Q4 of 2018 are all above 2.5 percent, with inflation just above 2 percent through the same time period. However, the longer range projections suggest an economic slow down approaching. Sticking to the good news: housing price and housing start expectations are up. In addition, consensus unemployment figures dropped yet again, with the expected consensus low occurring in the middle of 2019 at 3.8 percent. The recession probability dropped a full percentage point to 13 percent. Unfortunately, there are some more expected headwinds. Crude oil prices rose sharply in short run forecasts, with the June 2018 jumping almost 3 dollars to 58.55. The longer run forecasts of oil prices also rose, but by smaller amounts. However, the most concerning bit about current consensus expectations is the flattening of the yield curve. I have mentioned this several times in previous blog posts in my November and December updates. Here is a graph to illustrate the point with the newest data: 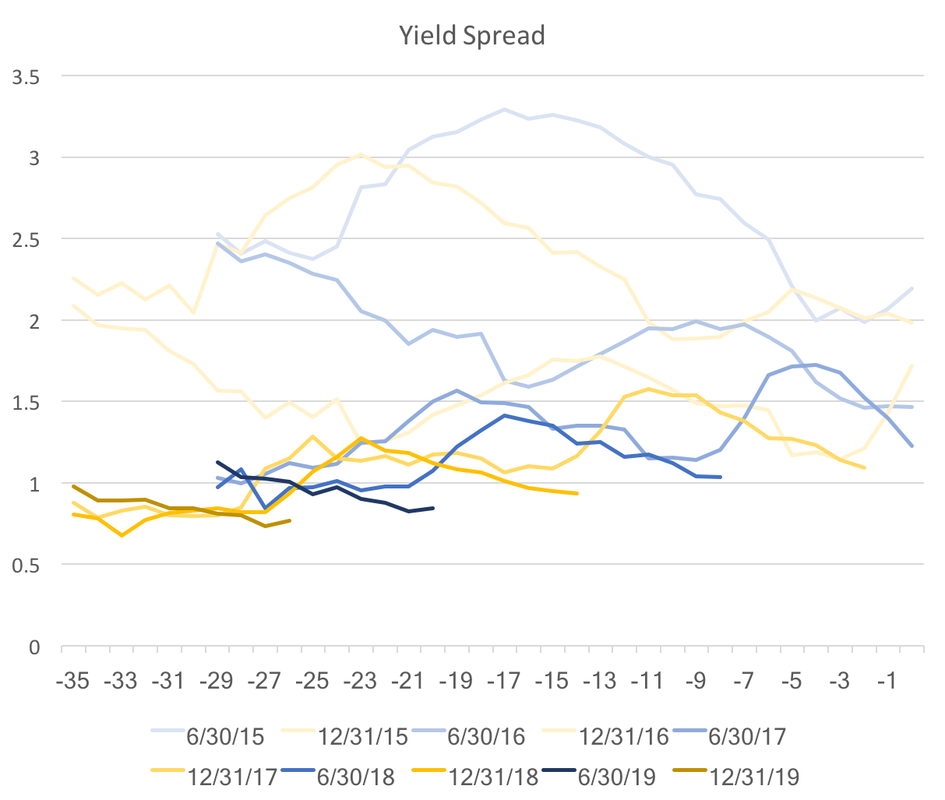 The graph above shows the difference between the consensus forecasts of the ten year bond rate and the federal funds rate. The color shade represents different future dates the darkest being the furthest in the future. We observe an abrupt jump down for the 2018 and 2019 spreads. A flatter yield curve has been cited as an indicator for a coming recession, and these forecasts suggest that tightening will happen over the next year or so.
The WSJ forecasters consensus is that 2018 should be a pretty strong economic year, but this expansion is heading towards its close as we move to 2019. There is a lot of talk about bubbles in the stock market. Robert Shiller used to think there was a bubble, and continues to believe the market correction is coming soon. Paul Krugman is less sanguine, attributing the stock market boom to a global phenomenon and foreseeing economic strength in the future. Given his exhaustive analysis of the Great Recession and the aftermath, I would not expect him to miss an opportunity to warn about another bubble bursting. I more or less agree with Krugman, and I think market participants agree too. Take a look at the dramatic increase in margin debt relative to credit balances in margin accounts in the NYSE: 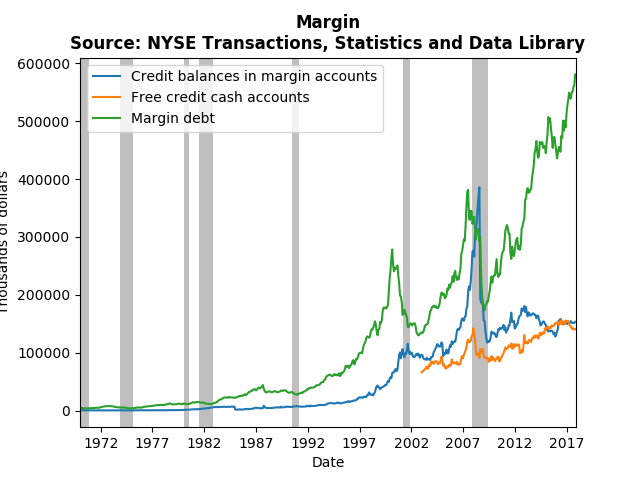 Clearly, the greatest risk takers (those trading on margins) are holding lots of long positions, while keeping short positions more or less constant. There has been a build up of credit in cash accounts, but it seems to be following the general upward trends of stock market participation. What I would be interested to know is whether the additional margin debt is due to new participants trading, or seasoned participants foreseeing long-term growth. If it is new participants, then there almost surely is a bubble. However, seasoned professionals would presumably be taking more short positions if the expected a coming crash. Should global stocks tank in the near future, it should be a big surprise.
The Fed raised rates recently keeping their promise of raising the rate in the face of positive economic data. The WSJ forecasts corroborate this rosy picture of the future economy and improving their forecasts from last month.
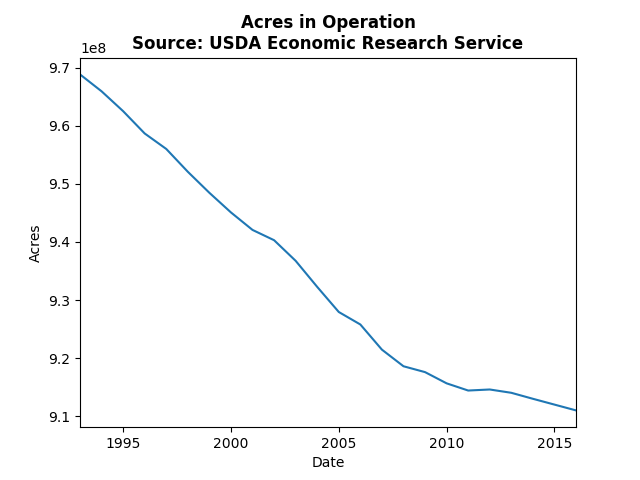
The consensus GDP growth forecast for the coming four quarters rose by a tenth of a percent or more, and all future unemployment numbers went down. It also looks like the forecast for the turning point in unemployment is being pushed out until mid 2019. The consensus probability of a recession in the next 12 months dropped half a percent to 14.1 percent. Some of the details however do not indicate the same degree of certainty in the future economic position. The expected gap between the federal funds rate at ten year bonds continues to tighten signaling a flattening yield curve, which means the Fed may struggle normalize long rates in time for the next recession. Expected housing starts and housing prices dipped a little, but not enough to be overly concerning. Of course it is no surprise given political turmoil in Saudi Arabia, OPEC extension of production cuts, and now the North Sea pipeline problems, that expected oil prices increased significantly. Expected prices increased by 2 dollars or more through 2018. All in all, there is a strong belief amongst the Fed and professional forecasters that board scope economic futures look robust, but there are still some potential weaknesses. My foray in to the turkey industry piqued my interest in agriculture in general. So this post explores what the trends in farming. Most economists discuss the structural change that occurs in economies by noting that farming used to command 60% of the labor force, and now less than 2% of the labor force is engaged in farming. Shifts of that magnitude result in changes in culture and policy, some times those changes take a long time to take effect (daylight savings anyone?). Continuing that trend, the graphs below show that the number total number of farms and acres operated have been declining over the past 23 years: The jump in 2007 was the result of a dramatic rise in small scale farms as we approached the great recession. However, the decline in acres in operation clearly indicates a decrease in land use. This is surprising because both exports and imports of agricultural products are increasing. The US remains a net exporter of agricultural products, which suggests the changes we see in the farming industry are a result of economies of scale: 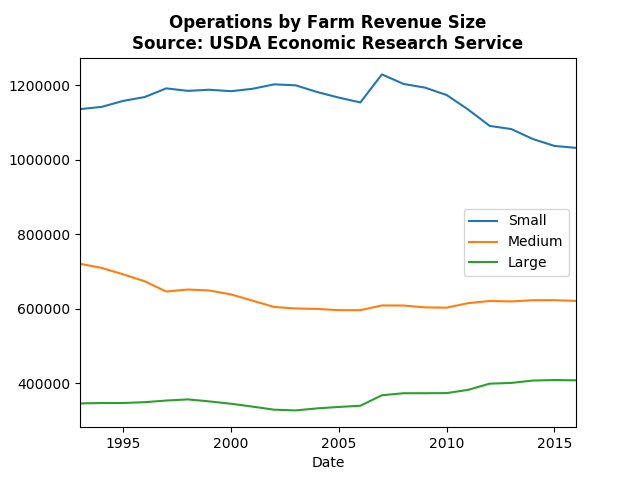 The number of small farming operations has decreased dramatically since the great recession, and the large scale farms are increasing. At the same time we do not observe a drastic change in the number of acres operated per farm: 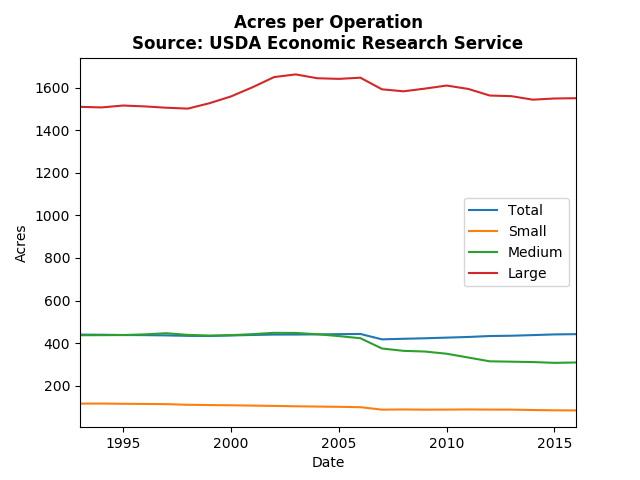 The only thing to note regarding acre per operation, is that medium scale farms are shrinking in size. Large scale farms purchasing the largest of the medium scale farms, or mergers of medium scale farms might explain these trends, but this can't be teased out of this data with certainty.
Thanksgiving is on its way and that brings concerns about whether there will be a turkey at the supermarket. This post takes historical data on turkey production from the USDA to see what the turkey market is like. The first thing to note is that exports of turkey are up as a percentage of total production. About 8 percent of US production is exported: 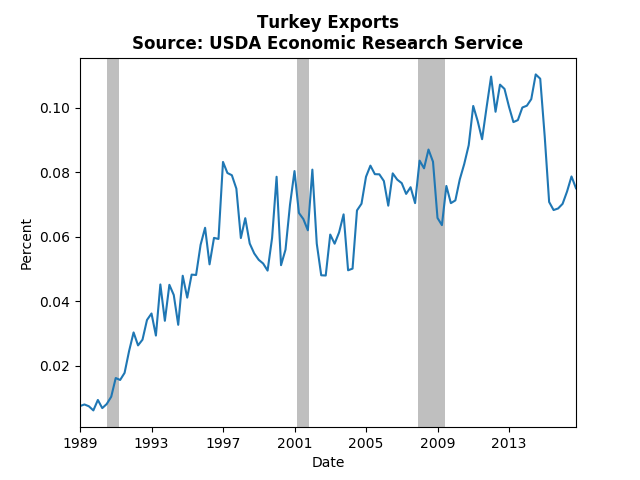 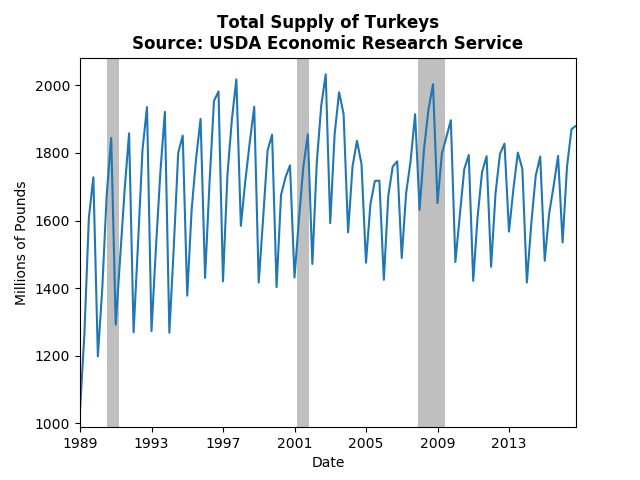 The total supply (less exports) has stabilized since the early 90's and there seems to be a long run periodic cycle layered on top of the usual seasonal cycles. However, if we look a bit closer at the data we can see that there are some significant changes over the past 3 decades: 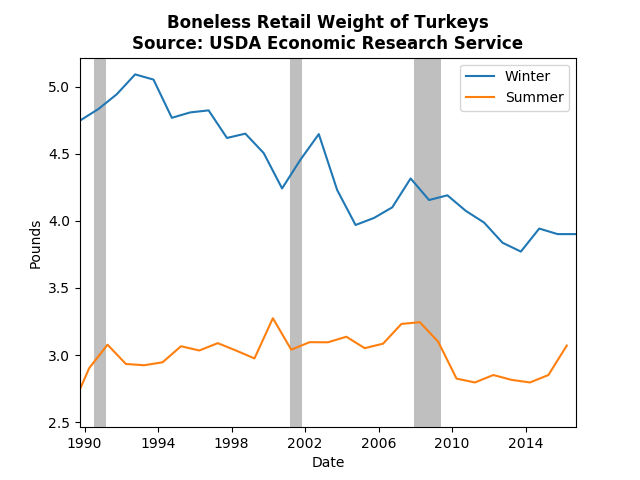 It appears we are consuming less turkey during the fourth quarter, basically our turkeys are getting smaller (the graph is similar for the full turkey). The comparison of summer to winter tells us that this isn't a general phenomenon, it really is only the Thanksgiving/Christmas boom that appears to exhibit a reduction in quantity.
Bottom line, I think our thanksgivings are including a lot more fixings than they used, which I very much appreciate. The most recent economic data continues to suggest a robust economy, and the WSJ Economic Forecasts reflect those facts. This post will present a brief overview of the changes in the average WSJ forecasts.
The main highlight from the GDP forecasts is a tenth of a percent increase in annual GDP growth for 2017, though only one quarter exhibited a decrease. Inflation forecasts also inched up in the near term (through 2018), but fell slightly post 2018. The positive employment reports have caused the predicted path of unemployment to shift down by almost a tenth of a percent as well, but the predict peak of employment is still around the end of 2018 or beginning of 2019. The probability of a recession in the next 12 months decreased by more than one percentage point to 14.6 percent. The expected spread between the ten-year bond yields and the federal funds rate continue to tighten. This means that the yield curve may flatten out over the coming years. If that comes to pass monetary policy makers will not have as many tools at their disposal for the next recession since they will only be able to impact the short end of the yield curve. End-of-year expected crude oil prices jumped up by over 3 dollars, however, longer term forecast rose more moderately. Housing price growth forecasts continue to increase. The end of the 2017 consensus is now expected to reach 6 percent. However, expected housing starts declined slightly through 2019. All in all, the recent data has moved forecasters to have a generally bullish view on the future economy. With the robust initial estimate of Q3 GDP growth (3 percent) and a strong employment report (+261K jobs) we have more indications of a strong economy. While I think most of the evidence does point in that direction, I am concerned about consumption patterns. Personal consumption expenditures have been increasing at a steady rate, however the composition of those expenditures is surprising. Durable goods just do not appear to be returning to pre-crisis levels: 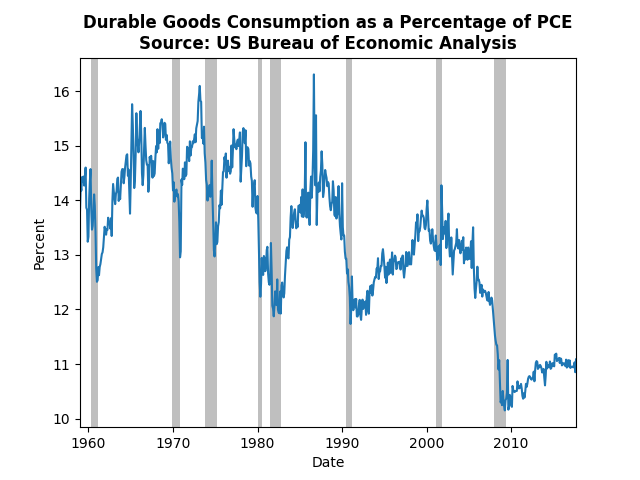 It is possible that this is part of a more general trend of decreasing reliance on durable goods, but the drop-off in the 2000's seems quite rapid. If the broad trend of decreasing significance of durable goods in our consumption bundle describes a change in the structure of the economy, that change may be accelerating. If however, the structure is more or less stable, then we have a long way to go before the economy gets back to normal.
The International Organization of Vine and Wine has recently released projections of wine production in 2017. It does not look good. By their forecast wine production will fall approximately 8.2% in 2017. They blame this calamity on poor climate conditions in Europe, which saw the largest declines in production.
Do not despair or start loading up on wine too soon, these numbers are only preliminary estimates. Using the previous press releases I found that the revisions to the estimates tend to be positive. Initial estimates are revised upwards by about 2 percent on average, but they could increase by as much as 7 percent. However, if the drop off in production is realized we can expect higher prices at the liquor stores over the next year, particularly for European wines. Based off the OIV press release, Argentinian wine might be the way to go since their production is estimated to have increased by 25 percent. |
Archives
May 2018
Categories
All
|