RSS Feed
|
WSJ Economic Forecast participants report the probability of a recession within the next 12 months. The consensus of the June survey participants has that probability at 16 percent. It appears that Q3 GDP growth appears to play a critical role in forecasters recession probabilities. The table below reports the results of a simple regression. 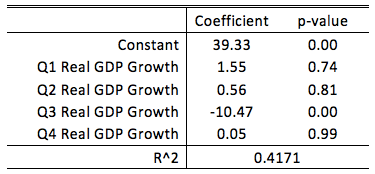 A forecaster who predict zero GDP growth in Q3 would place, on average, a 40 percent probability on the chance of a recession in the next 12 months. For every one percent increase in predicted Q3 GDP growth, that average recession probability would decrease by 10 percentage points. The other quarters do not appear to have a statistical relationship with recession probabilities.
Taken altogether, while a recession does not appear likely to these forecasters, the third quarter plays a pivotal role in these forecasts. The current consensus is 2.6% growth in the third quarter, only slightly below Q2 expectations. If we see weakness leading into the third quarter, we can expect forecasters to start increasing the probability of a recession.
0 Comments
Colleges have become increasingly expensive. College graduates are leaving college with more and more debt, yet everyone says that you need to get a degree. As the costs get higher, it no longer becomes clear whether that declaration still holds (see here and here). It makes sense then that sites like Payscale try to give consumers more information about their choices. Payscale provides a report once a year on the average annual salary of several schools (over 900 institutions). The table below lists the top 10 schools in 2016-2017 at the Early and Mid-Career levels. 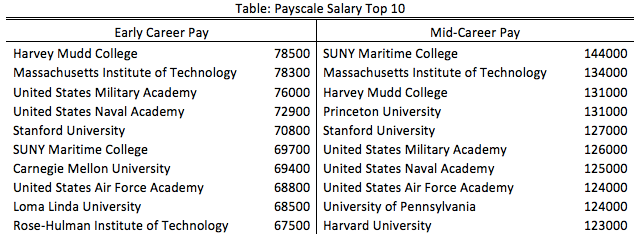 They are mostly elite colleges that only admit the top students, therefore, it isn't surprising that the receive high salaries. Also many of these universities are known for engineering. Thankfully, Payscale also provides the average salary for many college majors (over 300). Using this data and the IPEDS database we can reconstruct what colleges and universities average salary should have been had their graduates earned the average salaries for the degrees they earned. Using this constructed salary we can create a "mark-up" value. The two graph below show the top 10 Early and Mid-Career mark-ups. 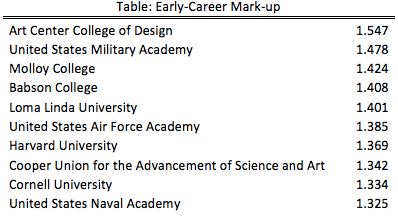 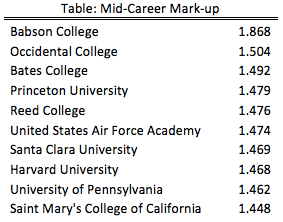 What a difference. There are still a few elite colleges and universities, but there are several surprising names amongst these lists. However, we still are forced to admit that the quality of the graduating students certainly reflects the quality of the entering students. So do these mark-ups reflect what students are getting out of their experience in school, or do the numbers just reflect the ability they brought with them. To address that the following table subtracts the early-career mark-up from the mid-career mark-up. If the number is large then it is likely that something about their college experience is being recognized as valuable by the job market. 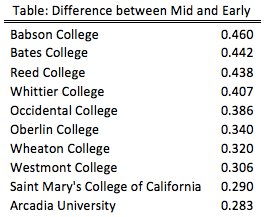 This top 10 is very different than the previous lists. This is a clear victory for small liberal arts colleges and their ability to transform lives. However, Babson College certainly deserve special recognition for being on all three top 10 lists. This analysis does not tell you which college to go to since it does not incorporate the costs. However, it does tell you which colleges provide an education that employers learn to value.
If you're interested in a particular college or university please leave a comment or send me an email. Over the past year there has been less disagreement across forecasters predicting the Federal Funds Rate, and unemployment. Not surprisingly as the forecast horizon (the time between the forecast and it's realization) decreases the agreement among forecasters increases. That is, there are fewer outliers because more is known. The WSJ Economic Forecasts display this property, however, using the payrolls employment forecasts we can isolate the changes additional variation outside of the monthly uncertainty. The graph below plots the normalized standard deviations for Employment Payrolls, Inflation, Federal Funds Rate, and Unemployment forecasts. 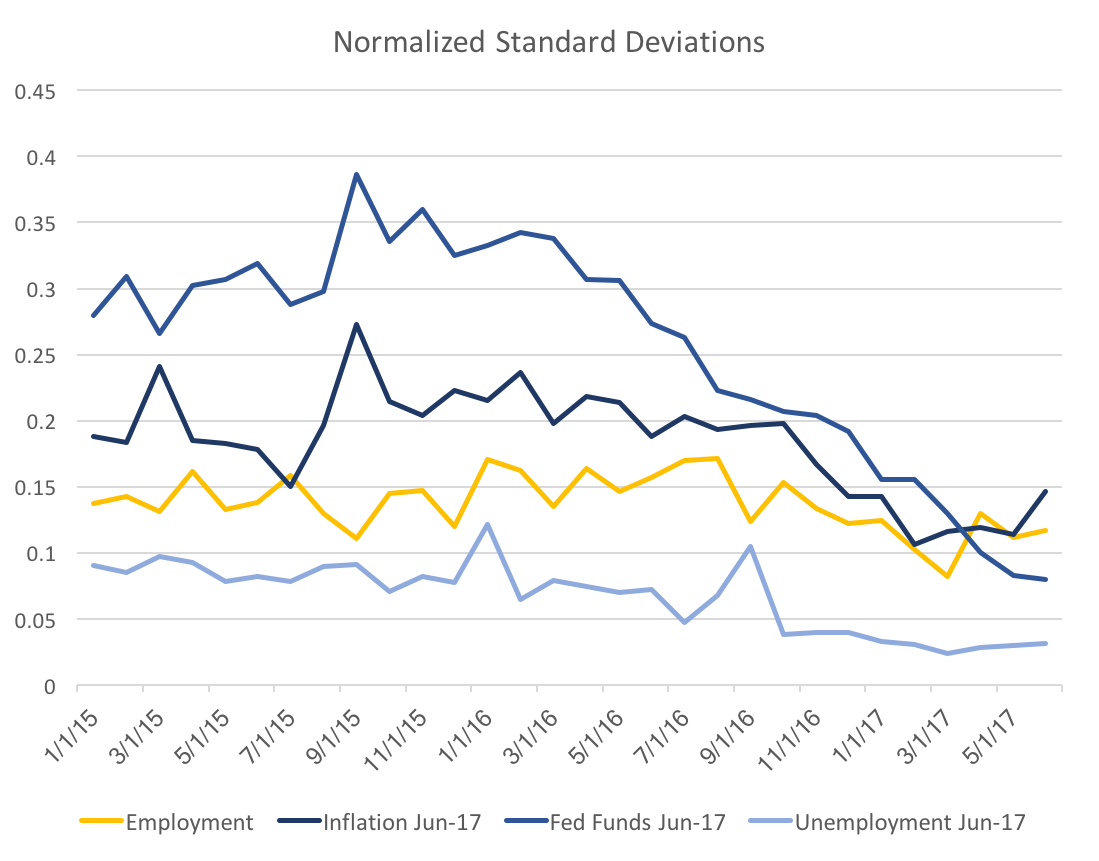 The yellow line of employment payrolls is stable, with a slight decrease in the past half year. In contrast, the Fed Funds Rate exhibits a very steep decline from a year ago. This is likely due to increased consistent messaging amongst FOMC participants as well as improved (and consistent) fundamentals. A large portion of the decrease is likely just due to the shortened horizon. The following graphs will display the forecast variability over all the forecast horizons. 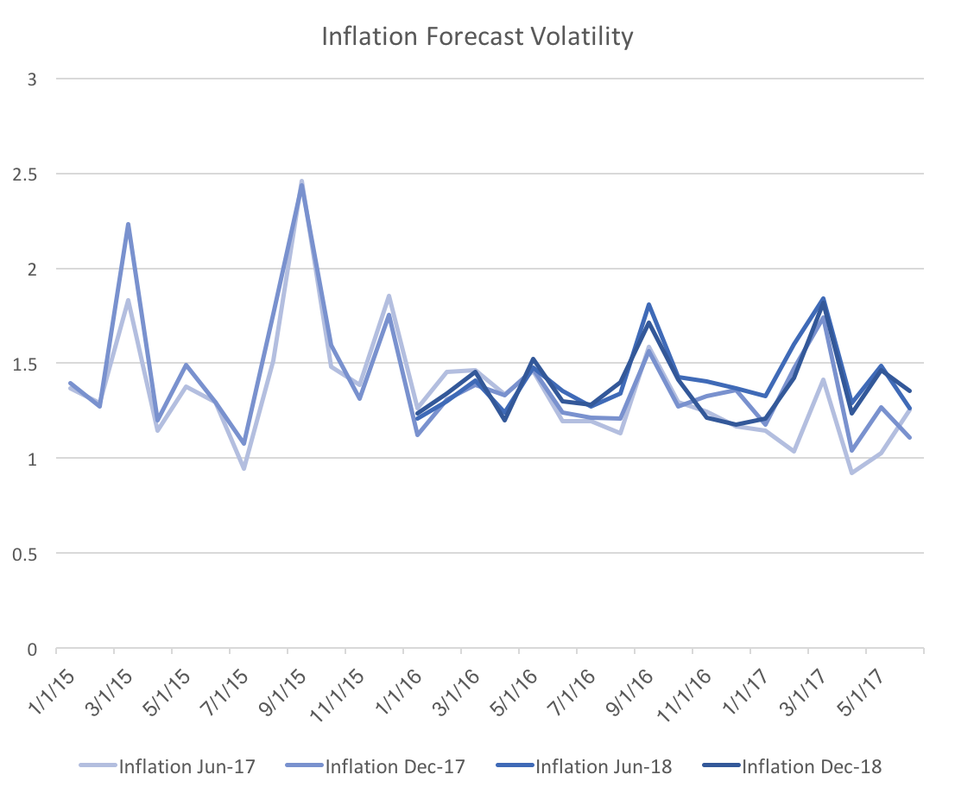 The graph above shows the four forecasts of inflation. Clearly once we control for the general uncertainty the slight downward trend of inflation forecast variability disappears. However, the graph below shows that that the downward trend very strong for the Federal funds rate forecast variability. 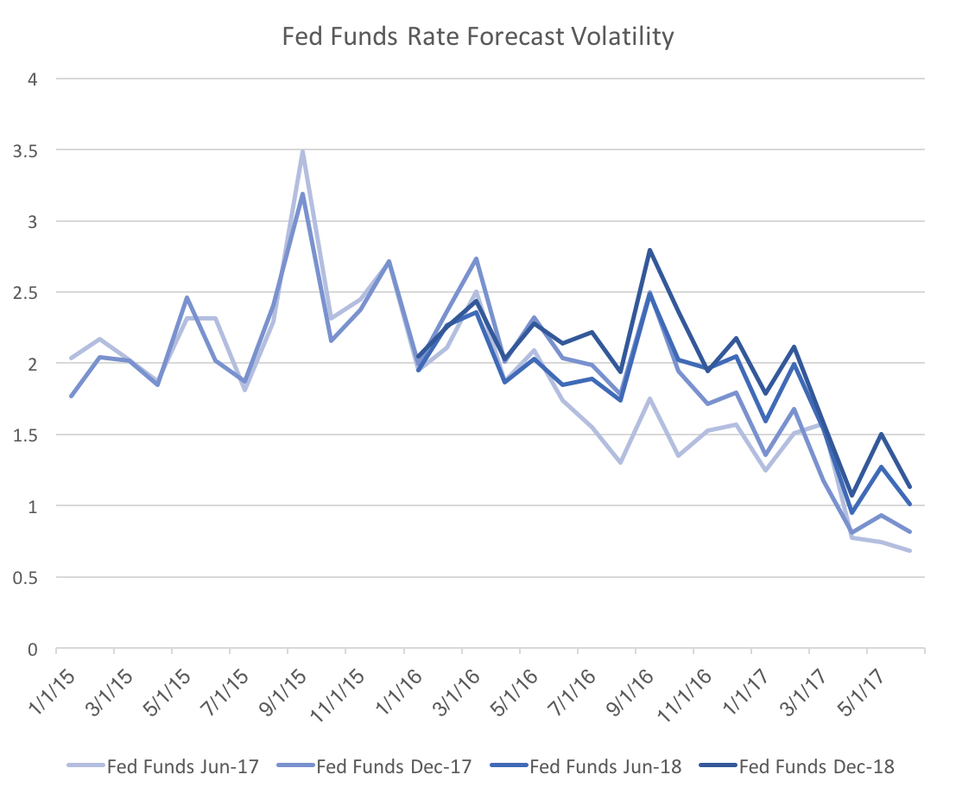 Also note that the drop is across all four forecasted dates, which implies that the result is not a normal change over forecasting horizons. Fed officials should be encouraged by this graph because it suggests the consistent messaging may be consolidating interest rate forecasts. 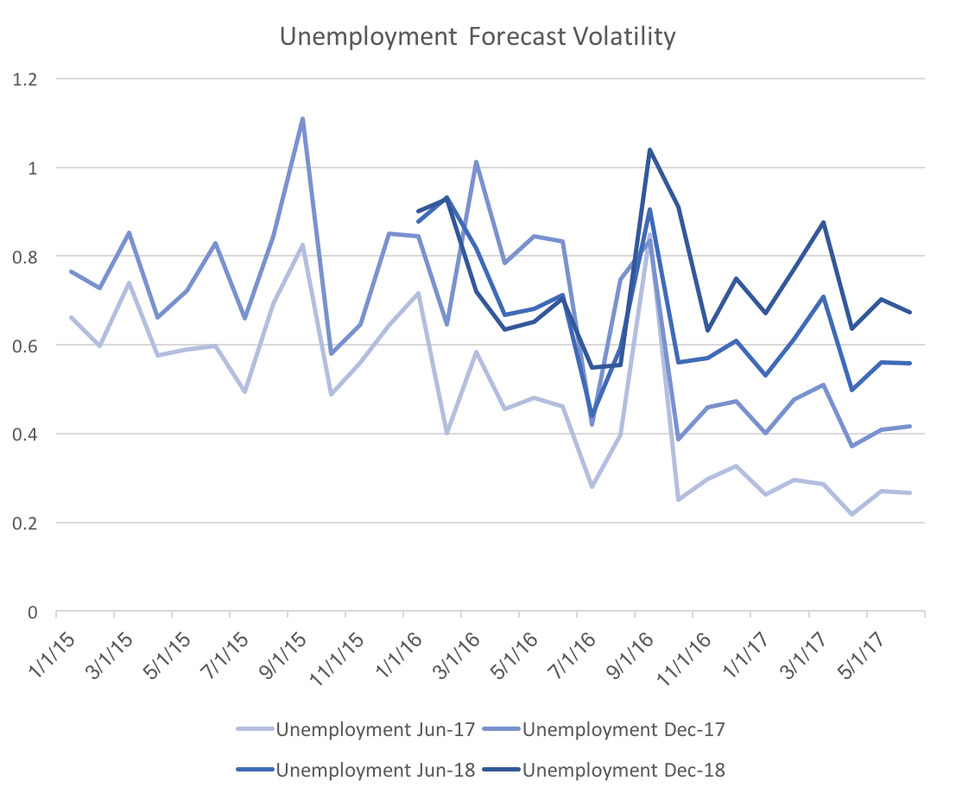 We see a similar, but slightly different graph for unemployment. Again it looks as though all four forecasted dates are decreasing in forecast variability. The main difference is that there is clear stratification across forecast horizons. From this graph it is unclear whether forecasters truly are more certain, however, I suspect the clear stratification across forecast dates indicates a typical spread of forecast horizon uncertainty.
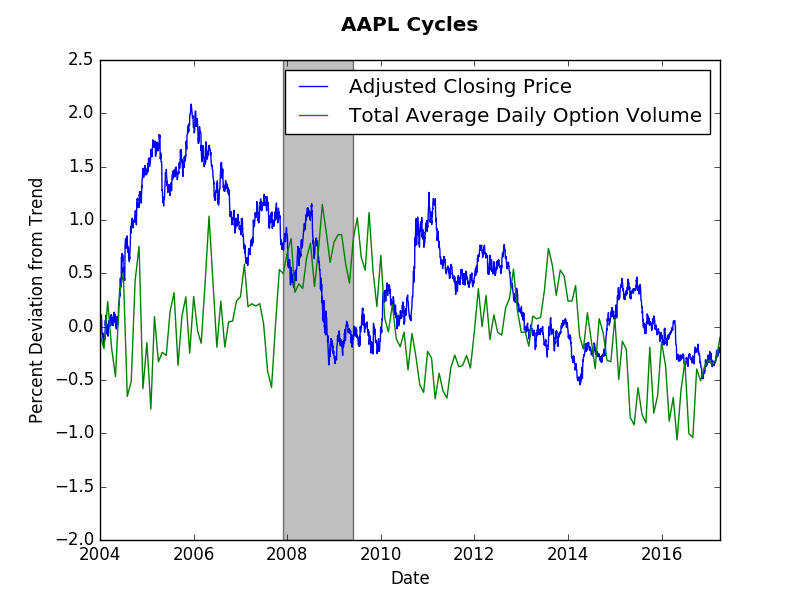
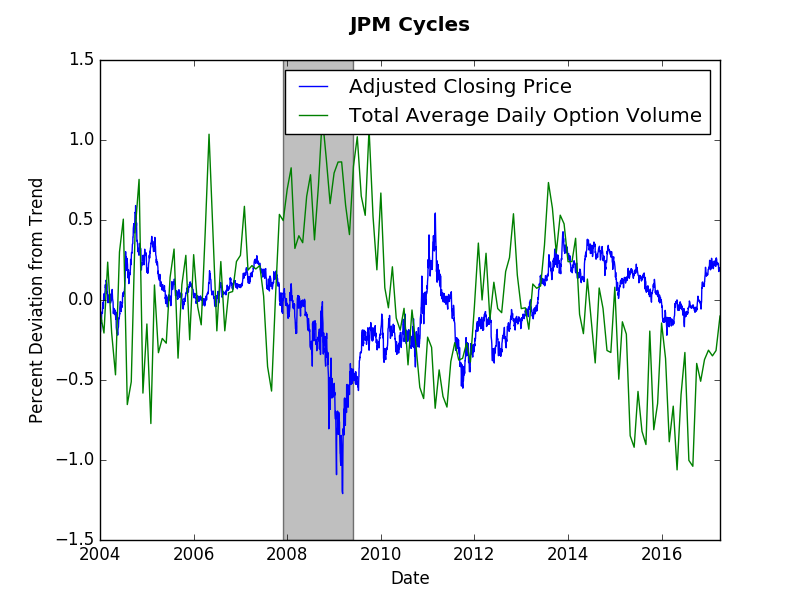
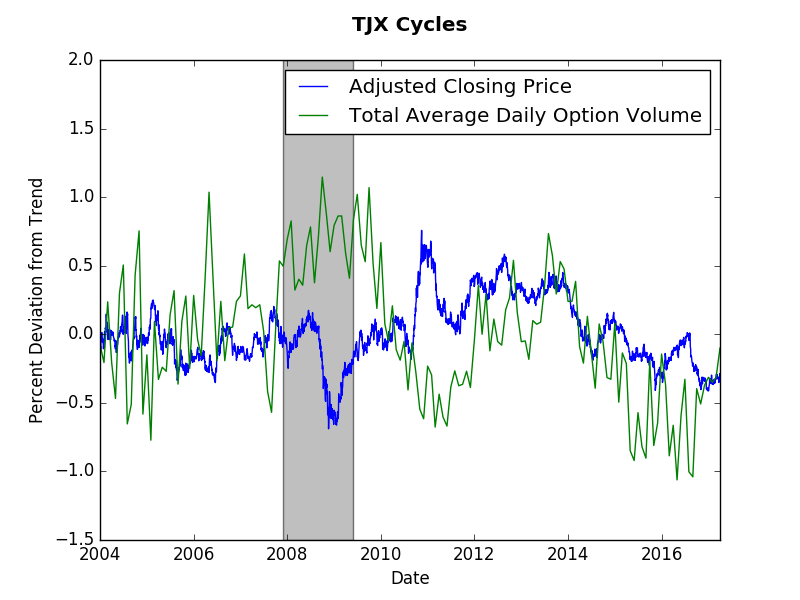
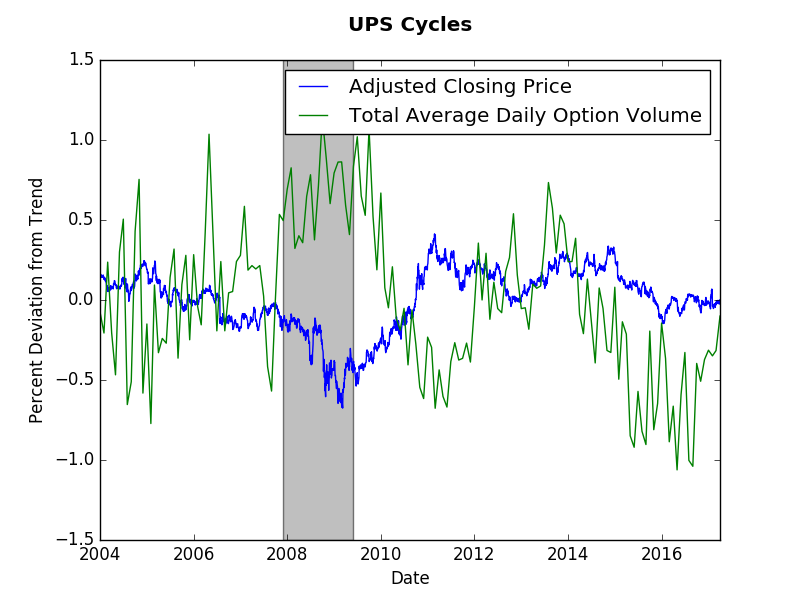
The short answer? No. The long answer will probably need to wait for a detailed academic paper. However, this post will present some suggestive evidence that the short answer above is correct. We will look at end of day price data (obtained via wiki EOD) and monthly options volume data (obtained from the CBOE). As usual, the Hamilton cycle method provides my preferred measure. This post shows that options volume tend to have longer cycles than stock prices. Our evidence will come from four stocks: Apple (AAPL), JP Morgan (JPM), TJ Maxx (TJX), and UPS. As you observe the graphs consider a cycle to be several months away from trend (zero). The graphs below present those cycles. Options and stock price do not appear to exhibit any synchronicity. Options cycles seem the same across these stocks despite them coming from different sectors of the economy. The only consistent fact is increased options volume and a decrease in stock price during the Great Recession. Options volume appears more jagged, which makes it harder to assess the cycles. However, if we were to look at stock volume we would find even more volatility.
To answer the question at hand let us just count the number of deviations from trend for each company. For Apple, 5 option cycles and 6 price cycles. For JP Morgan, 5 option cycles and 7 price cycles. for TJ Maxx, 5-6 option cycles and 7-8 price cycles. Finally, for UPS, 5 option cycles and 5 price cycles. This by no means is a statistical test, however, it does suggest that over the same time period there were fewer options cycles than price cycles. One can think of the option cycle as the force of speculation on the future stock price, whereas the current stock price cycle reflects more frequent news about firm value. Perhaps the lack of options trades (relative to stock trades) slows down the formal speculative market. When this post idea came to me, I expected a stronger correlation between prices and options. The lack of correlation true (more or less) when comparing stock volumes (the graphs were messier though). Any thoughts? Please comment below... If you would like to have a similar graph of a specific company let me know. On June 14th the FOMC decided to increase the Federal Funds Rate. This move was almost perfectly anticipated by the WSJ Economic Forecast Survey participants. However, a close look at their revisions to the future rates has them leaving the Fed funds rate mostly unchanged, but seeing significant declines in Ten-year bonds particularly in the short term. The graph below shows the changes in expected interest rates through the end of 2019. 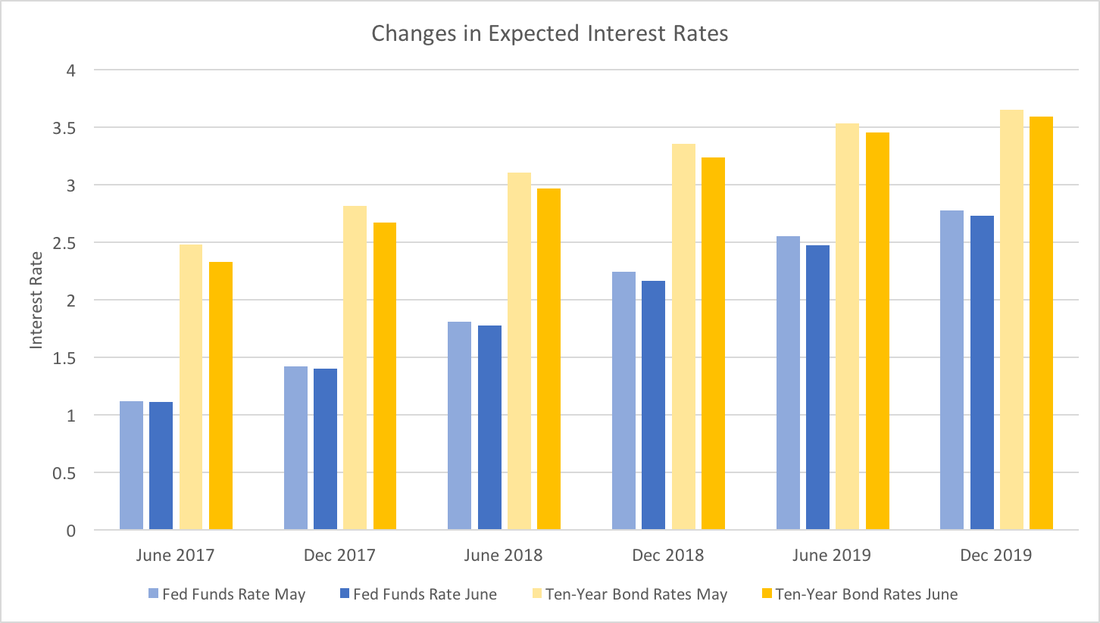 While June and December 2017 Federal funds rates forecasts are almost identical, the Ten-year Bond rates have dropped significantly. This could reflect greater certainty over Fed policy, and less perceived economic risk in the short-term. That is, the Fed has been effectively communicating their criteria for raising rates and participants forecasts have not seen a reason to change the projected path. Since the data have been, for the most part, positive, forecasters believe the bond markets will incorporate the lower economic risk into the bond rates. Taken as a whole, this suggests that expectations about the short-term future economy are good.
Turning to the longer-run (in 2019), both expected rates have dropped slightly. Given the long forecasting horizon it may only reflect reversion to the mean (what goes up must come down). However, I suspect that forecasters recognize that while the economic data has been positive, it has not signaled robust growth. Essentially, we are still (very slowly) climbing out of the hole the financial crisis created and we should continue to do so for the next two years or so. This post examines the WSJ Survey specifically looking at forecasts of the unemployment rate. Compared to previous posts on GDP, Fed Funds Rate, and Economic Risk, forecasters have high expectations for the future unemployment rate. In particular, they have become increasingly optimistic about 2018 relative to 2017. The graph below depicts the average forecasted unemployment rate for each month since December 2015 across June and December in 2017 and 2018. The lines become darker the closer the forecast is to the present. 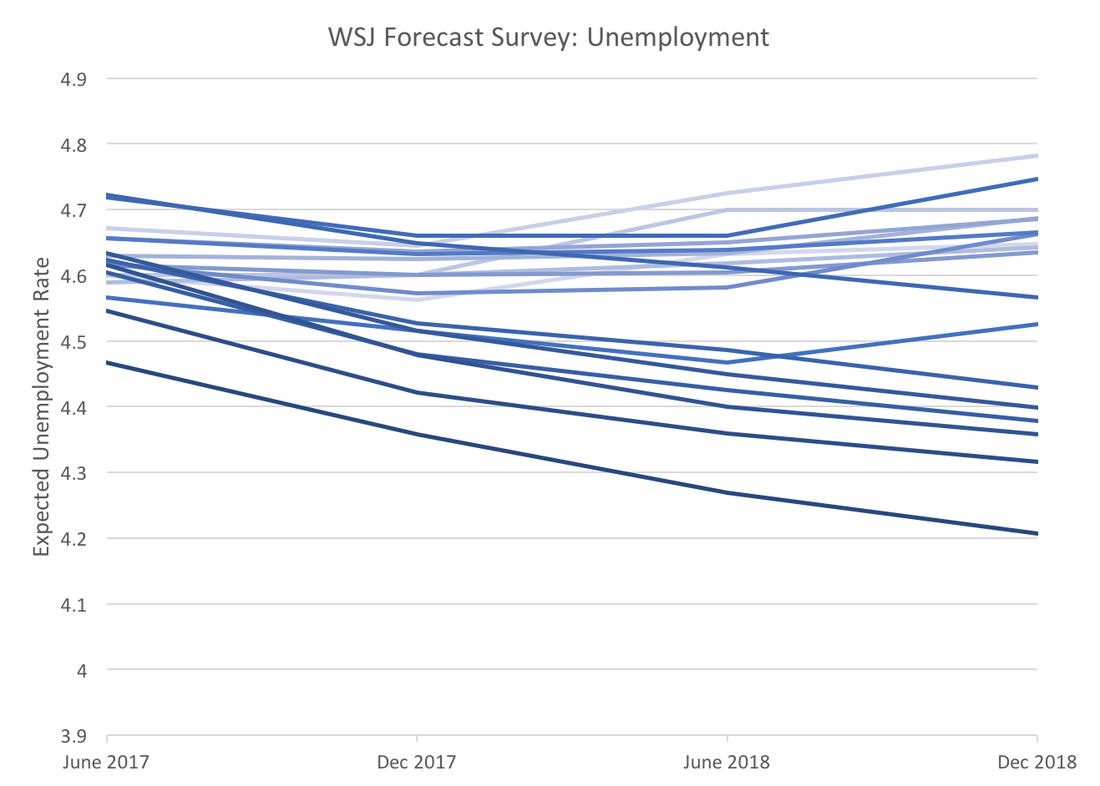 Forecasters are not just becoming optimistic about short-term unemployment, but they are also expecting the trend to continue for a year and a half. A year ago they were expecting the end of 2017 to be the low point in the unemployment rate. The current consensus forecast for December 2018 is 4.21 percent, a rate not seen since prior to the Dot Com bubble, however given the recent unemployment numbers (4.3%) this expectation seems plausible.
The upbeat unemployment forecasts put the more tepid GDP and interest rate forecasts in perspective. More than likely the most recent revisions are an overreaction to the strong April payroll employment numbers. The more recent May payroll and unemployment values send a more mixed message more consistent with previous GDP and interest rate forecasts. The WSJ economic forecasting survey asks for forecasts of ten-year bond rates. Used in conjunction with the Federal Funds Rate we can get a glimpse into whether market participants foresee the yield curve rising or falling over the coming years. A flatter yield curve can suggest two things, slower future economic growth or decreased economic risk. Two caveats to the analysis below: we only have two points on the yield curve and forecasts for bond rates exhibit a lot of variation. With those caveats in mind the graph below depicts the average spread between forecasted ten-year bond rates and the federal funds rate. As the spread gets smaller, the yield curve becomes less steep. Though there is a minor increase forecasted for the end of 2017 the overall trend remain downward. 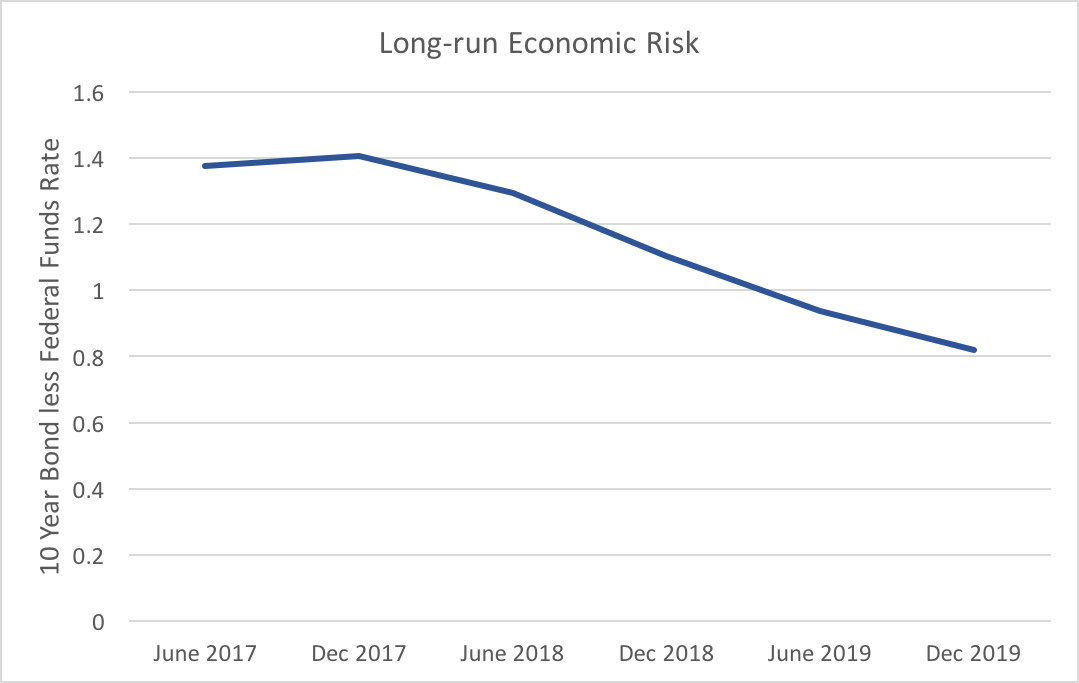 The flattening of the expected yield curve is mostly driven by increases in the Fed funds rate, which is expected to rise 1.66 percentage points from June 2017 to December 2019, whereas ten-year bonds are only expected to rise 1.11 percentage points over the same timeframe. Market participants do not expect the longer end of the yield curve to respond strongly to Fed action.
To reiterate one of the caveats above, while the average of these forecasters shows a definite trend, we see a fair amount of variability. Fifteen percent of participants who provided all forecasts for both ten-year bonds and the federal funds rate expect the yield curve to become more steep. Even though, the consensus clearly points to lower risk and slower future economic growth, that degree of variation provides enough uncertainty to warrant attention to changes in the expected yield curve. Today we take another look at the WSJ Economic Forecast Survey. This time we focus on non-farm payrolls. In some sense, non-farm payrolls provide a more accurate picture of the labor market than looking at headline unemployment. Typically we look at the change in non-farm payrolls. The graph below presents actual non-farm payrolls (in yellow) and the consensus forecast (in blue). 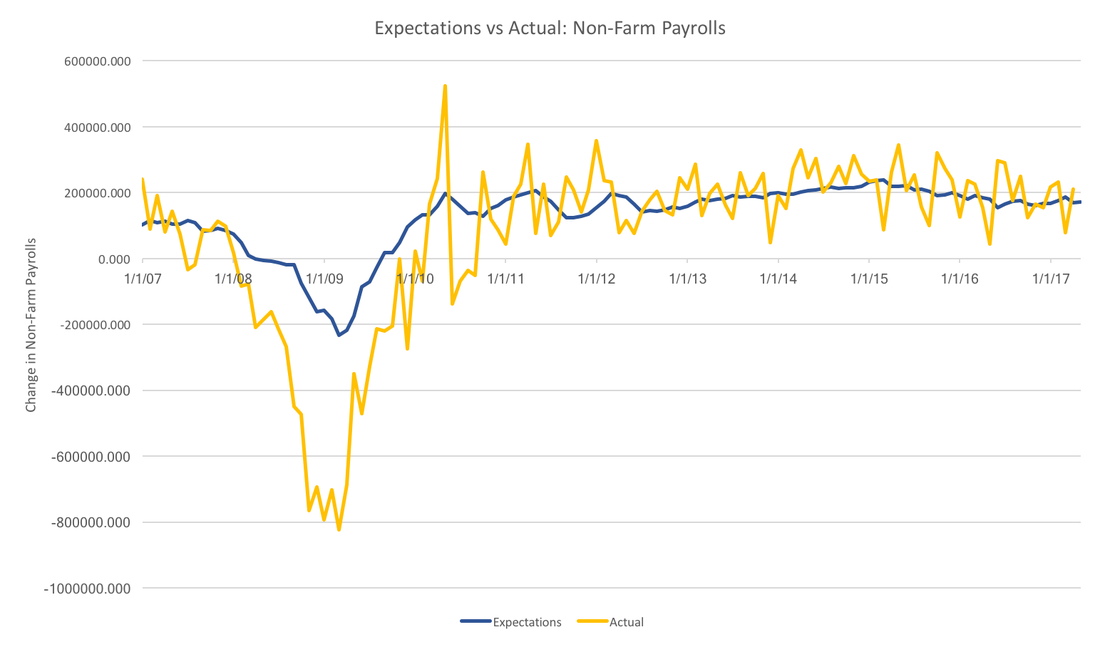 In general, the forecasters have been more or less on the trend over the past few years, however, they severely underestimated the Great Recession. In fact, the worst any individual thought job losses would be was 400,000, whereas job losses actually reached 750 thousand per month. While forecasters do seem to do well with the overall trend, they do not capture anything close to the month to month variation seen in the realized data.
Payrolls data suffer from major revisions. It is unclear whether forecasters are targeting initial estimates, or revised estimates, however, the picture above would be qualitatively unchanged. In the face of this much volatility it also makes sense for forecasters to focus on the trend rather than the noise. This strategy has served survey participants well, except for the recession. For now, it is unclear why forecasters were systematically over-optimitisic during the great recession. Liberty Street Economics just posted about their recent housing survey. They see a sharp increase in the housing price expectations by consumers. That local level survey reinforces the expectations of the WSJ forecasters. The graph below depicts the consensus expectations for housing price growth for the year of 2017. The light yellow line shows the actual annualized growth rates. 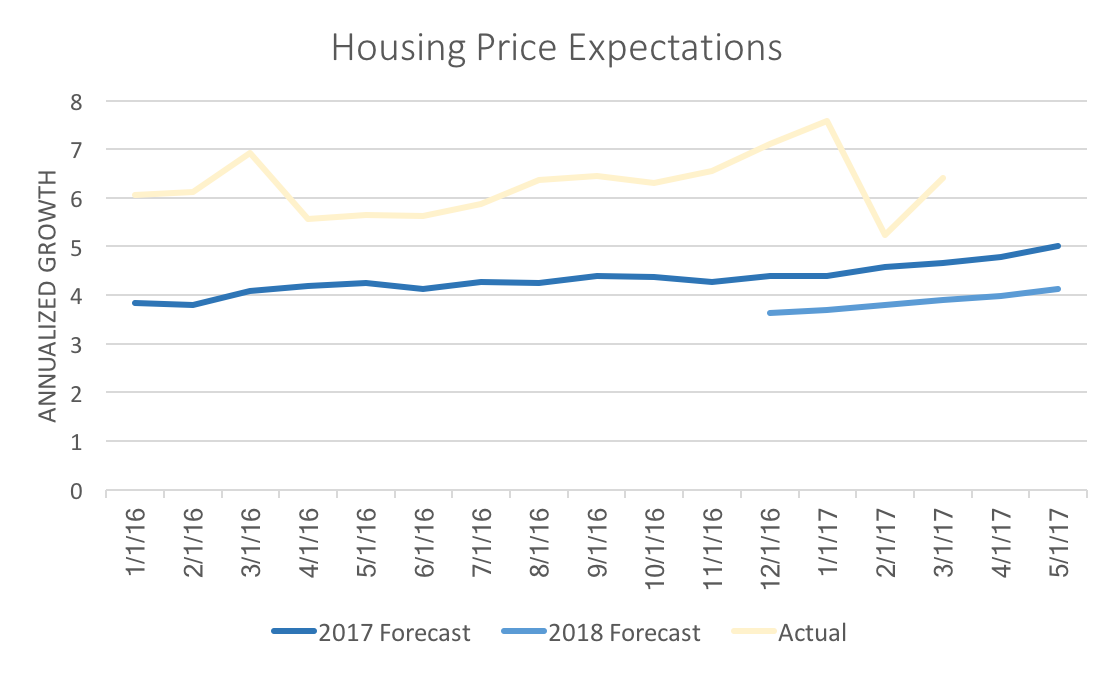 Liberty Street shows changes of expectations from one year to the next, but with the WSJ forecasters we are able to observe a steady increase in estimates over the last 15 months. Predictions for 2018, while lower than 2017, also have become more optimistic. This is partial due to continued rapid growth of actual house prices. Again, the data above corroborates Liberty Street's story using different data (FHFA housing price index supplied by Freddie Mac vs the Case-Shiller index used by Liberty Street).
Housing price growth is expected to slow down, however, both consumers and financial professionals agree it will not slow down too much. Recently the WSJ made the May economic forecasts available on their website. In replicating the previous analysis it became clear that the results were influenced by the selected sample. The proper comparison, requires that all values are calculated using the same group of forecasters. The table below reanalyzes data of the 37 forecasters that provide forecasts for Q1, Q2, Q3, Q4, and the full year of 2017. It includes the May forecasts. 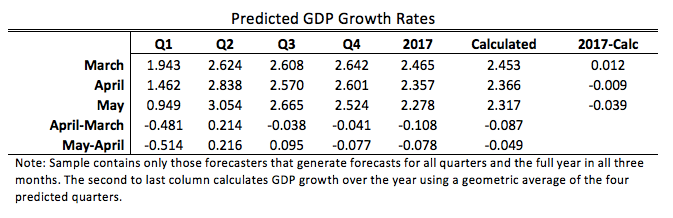 Forecasters have become increasingly pessimistic about annual growth, while remaining more optimistic about individual quarters. Their predicted annual growth rates have fallen 0.186 percentage points, whereas growth rates calculated using a geometric average of predicted quarterly rates have fallen 0.126 percentage points. As a consequence, calculated annual growth went from being higher than reported annual growth to being lower.
Solid predicted growth in Q2 outweighed the lackluster economic performance of the first quarter. The significant drop in the first quarter reflects the advanced estimate of GDP reported by the BEA in April. |
Archives
May 2018
Categories
All
|