
 RSS Feed
|
This post uses Shiller's historical data and Hamilton's method for extracting cycles to analyze three S&P aggregate indices: prices, earnings, and dividends. With these cycles one can assess when to form a portfolio comprised mostly of value, income or growth stocks. If a particular aggregate index approaches the peak in its cycle the strategy associated with it will no longer provide the best returns, and vice versa. The analysis below assesses which of the cycles is most favorable. 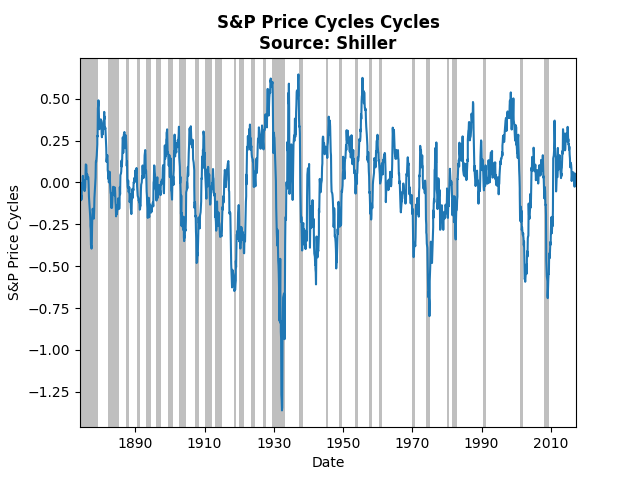 The graph above displays cycles over the monthly price index of the S&P. The current cycle has come off of its peak and appears right on its trend, which suggests growth investing may not provide the best strategy. Note that prior to the Great Depression the cycles almost perfectly coincide with recessions, whereas post Depression the relationship has broken down. Also note that the biggest negative spike occurred during the Depression. 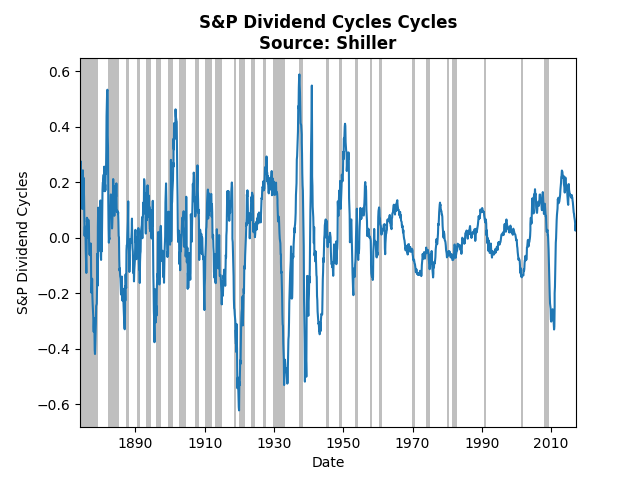 Dividend cycles, follow a somewhat similar pattern. Income investing also suffers from a cycle heading toward its trough. The lowest cycle occurred during the crash of 1920, the lesser known depression. 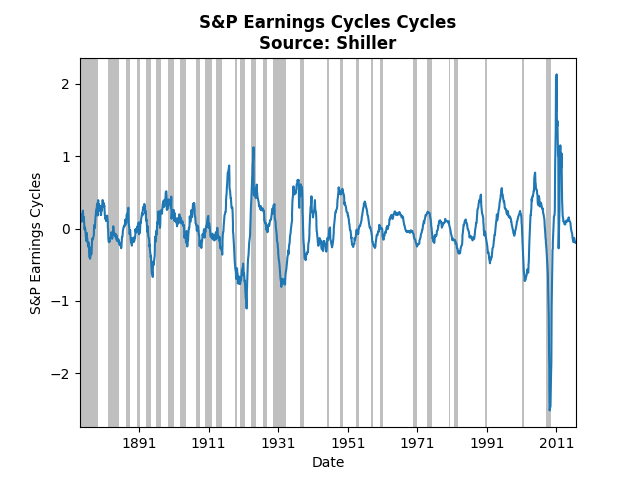 The graph above shows the same analysis of the S&P earnings index. Clearly the financial crisis had a huge impact on earnings, even relative to the Great Depression. The current cycle is slightly below trend and on par with many of the past troughs. Taken all together, the cycles imply that the best strategy at the moment is value investing. The cycles for prices and dividends do not appear to have hit their bottom, whereas earnings may soon pick up.
0 Comments
Leave a Reply. |
Archives
May 2018
Categories
All
|