|
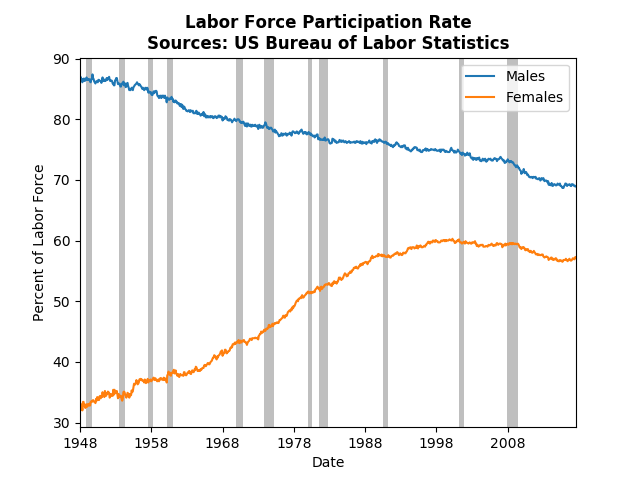
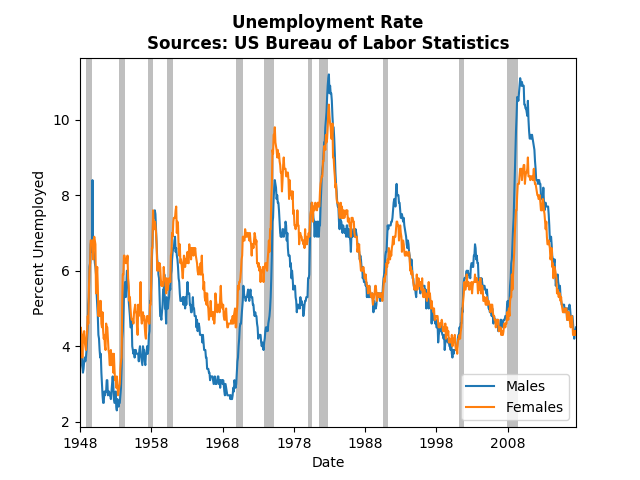
The dynamics in the labor market and higher education are remarkably different depending on whether we look at males or females. This post will highlight those differences and specifically look at how the dynamics differ by the type university (for-profit vs not-for-profit). First just to illustrate the different long run dynamics and their importance we quickly examine the labor force. Male labor force participation has steadily decreased since the WWII. While female labor force participation has leveled off since the 90's, female participation is recovering from the great recession, whereas males participation continues to decline. The story is even more incredible if one looks at the unemployment rate. Pre 1980, the female unemployment rate was consistently above the male unemployment rate. Since the 80's an unusual pattern has developed. Men face higher unemployment rates during and after a recession, but then eventually unemployment rates equalize. We have only observed four such occurrences, so it is unclear (at least to me) why that is the case. However, we know that many of the long-run changes in the labor market in the US has been the shift toward high-skill, college-educated, workers. Women have enrolled in college and universities at a higher rate than men for many years, which may be what is influencing the differences observed in the labor force and unemployment rate. To investigate this I used the IPEDS data service and collected data on 1574 colleges in 2001 and 2015. What struck me as interesting is how the different types of higher education institutions interact over the gender over time. The table below presents the enrollment rates of public, private not-for-profit, and private for-profit schools in 2001 and 2015. Not surprisingly enrollment rates have dropped for both men and women over that time frame. In addition, the not-for-profit institutions have lower enrollment rates than for-profit institutions. While public institutions do have higher enrollment rates than private not-for-profits, in 2001 both more or less treated men and women the same. However, in 2015 females have a lower enrollment rate than males. If we compare for-profit to not-for-profit, the for-profits have actually improved their "gender bias." Why might these numbers look this way? It's likely that these institutions are responding to the general call for attention to diversity. Since more women enroll in college, colleges must try to attract more men. In that case, we should look at the ratio of applications to enrollment: As mentioned, more females apply and enroll in not-for-profit colleges. However, in 2001 the application to enrollment ratio was very nearly 1, but that value dropped in 2015.This means that relative to the male to female ratios in the applications there were fewer females actually enrolling relative to the males at not-for-profit institutions. This suggests that women apply to more colleges than men.
If instead we examine the for-profit schools we see the opposite dynamics. First, males were a higher percentage of the number of applications and enrollments (about 50% more in 2001!). But relatively speaking compared to the enrollment ratio, there were more females who should have enrolled in these for-profit institutions (about 5% more). That number improved from 2001 to 2015, but it still suggests that women are applying to more institutions then men. The final takeaway from this data: Women are applying to colleges at a higher rate then men, and that behavior has equalized across the types of colleges. That is, in 2001 men and women applied to the roughly same number of not-for-profit colleges, but more women applied to more for-profit colleges. In 2015, however, women applied to more colleges then men regardless of the type of college. Over that same time period it has become relatively easier for men to attend colleges.
1 Comment
|
Archives
May 2018
Categories
All
|

 RSS Feed


