
 RSS Feed
|
The WSJ Economic forecasters report on two housing market indicators: FHFA housing price index growth, and housing starts. Admittedly I do not spend a lot of time forecasting housing, but the following graph makes sense to me: 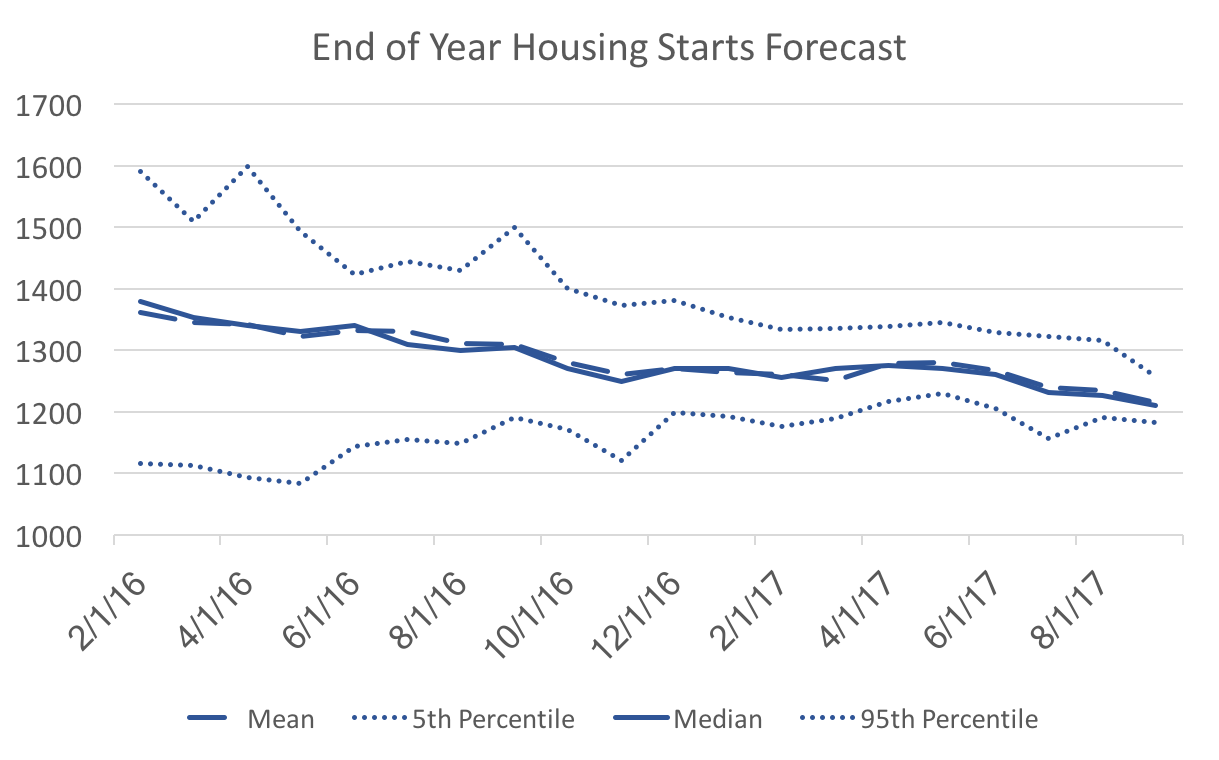 Over time forecasters are reaching a consensus of the likely value of housing starts in December. It is a little lower than the mean and median at the beginning of 2016, but still easily within the range of forecasts at that time. The economy in general has not been as robust as people thought it might be (a strong recovery has never materialized), and so the decline in consensus is consistent. However, the following graph confuses me: 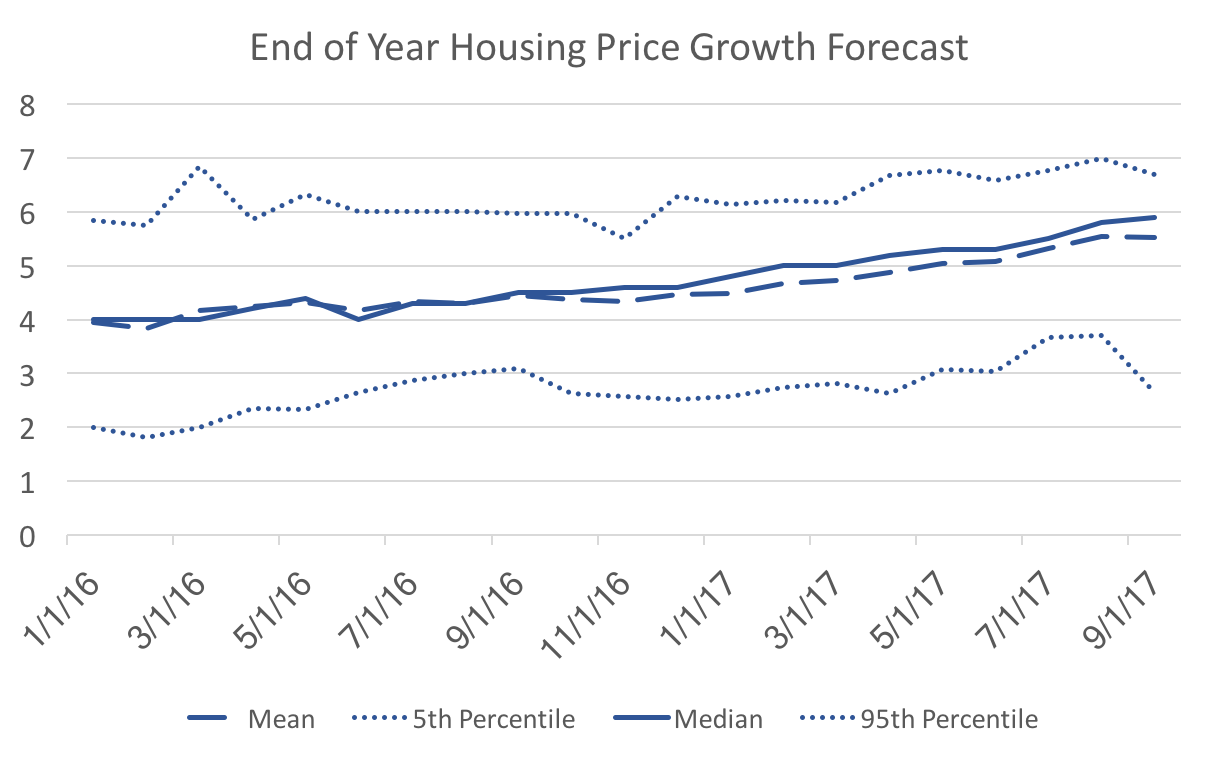 We do not see a similar convergence to the mean, and instead we observe the forecast becoming more skewed over time (lots of high forecasts a few very low forecasts). We are only three months away from the realization and there is the same spread between the 5th and 95th percentiles as 21 months ago. What would cause some of the forecasters to hold such low housing price growth expectations relative to their peers? The only thing I can think is that those few outliers must anticipate an immediate and steep decline in housing prices.
On another note: I wonder if the change in forecast averages (higher prices and lower quantities) might indicate the the supply-side factors (production/construction) dominating the housing market. That is productivity is lower than forecasters expected. Whether that is low enough to signal a coming recession is not clear, but I keep looking at this forecast data with a fair amount of pessimism.
0 Comments
Leave a Reply. |
Archives
May 2018
Categories
All
|