
 RSS Feed
|
Today we take another look at the WSJ Economic Forecast Survey. This time we focus on non-farm payrolls. In some sense, non-farm payrolls provide a more accurate picture of the labor market than looking at headline unemployment. Typically we look at the change in non-farm payrolls. The graph below presents actual non-farm payrolls (in yellow) and the consensus forecast (in blue). 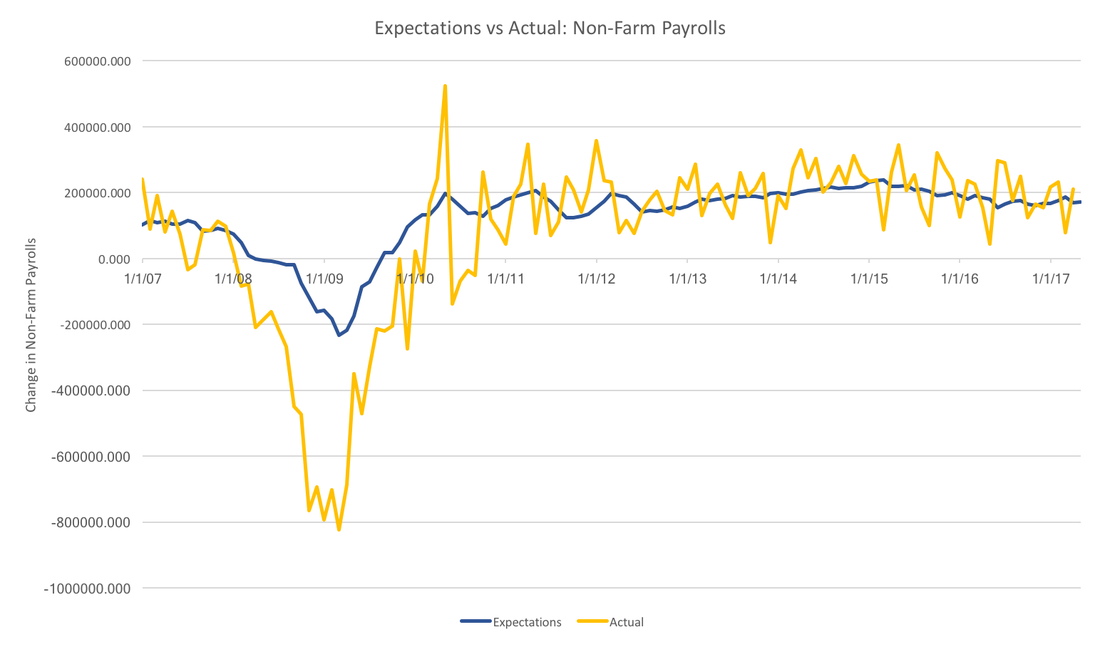 In general, the forecasters have been more or less on the trend over the past few years, however, they severely underestimated the Great Recession. In fact, the worst any individual thought job losses would be was 400,000, whereas job losses actually reached 750 thousand per month. While forecasters do seem to do well with the overall trend, they do not capture anything close to the month to month variation seen in the realized data.
Payrolls data suffer from major revisions. It is unclear whether forecasters are targeting initial estimates, or revised estimates, however, the picture above would be qualitatively unchanged. In the face of this much volatility it also makes sense for forecasters to focus on the trend rather than the noise. This strategy has served survey participants well, except for the recession. For now, it is unclear why forecasters were systematically over-optimitisic during the great recession.
0 Comments
Liberty Street Economics just posted about their recent housing survey. They see a sharp increase in the housing price expectations by consumers. That local level survey reinforces the expectations of the WSJ forecasters. The graph below depicts the consensus expectations for housing price growth for the year of 2017. The light yellow line shows the actual annualized growth rates. 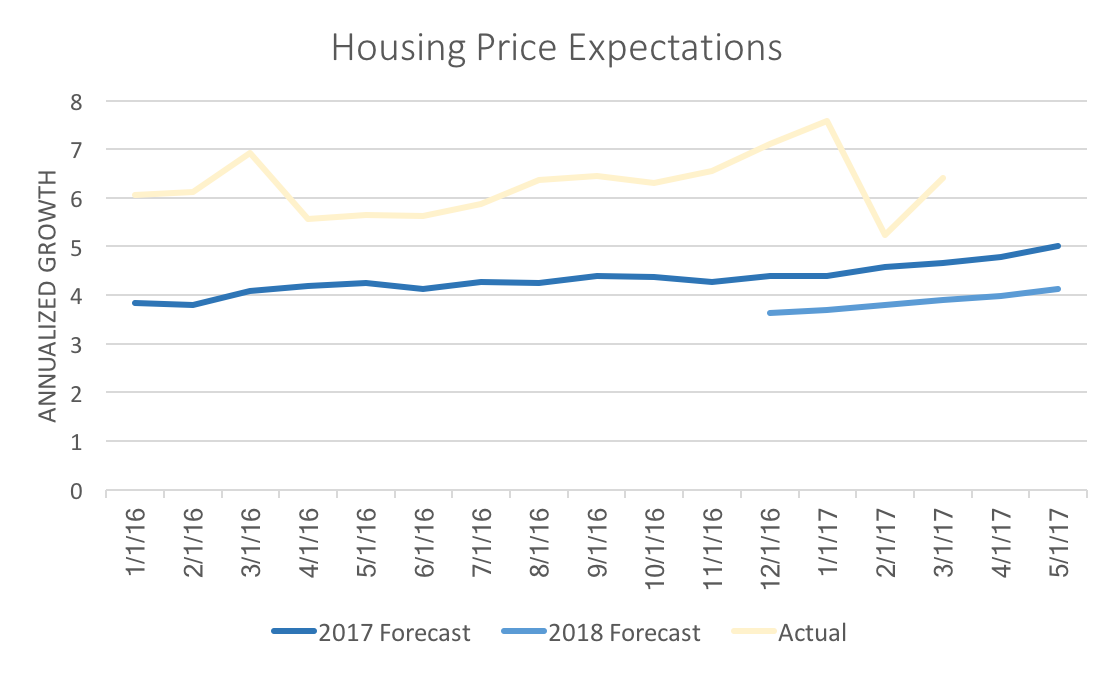 Liberty Street shows changes of expectations from one year to the next, but with the WSJ forecasters we are able to observe a steady increase in estimates over the last 15 months. Predictions for 2018, while lower than 2017, also have become more optimistic. This is partial due to continued rapid growth of actual house prices. Again, the data above corroborates Liberty Street's story using different data (FHFA housing price index supplied by Freddie Mac vs the Case-Shiller index used by Liberty Street).
Housing price growth is expected to slow down, however, both consumers and financial professionals agree it will not slow down too much. Recently the WSJ made the May economic forecasts available on their website. In replicating the previous analysis it became clear that the results were influenced by the selected sample. The proper comparison, requires that all values are calculated using the same group of forecasters. The table below reanalyzes data of the 37 forecasters that provide forecasts for Q1, Q2, Q3, Q4, and the full year of 2017. It includes the May forecasts. 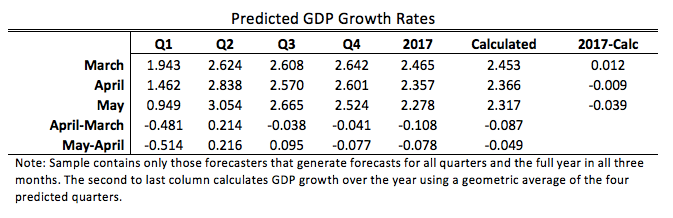 Forecasters have become increasingly pessimistic about annual growth, while remaining more optimistic about individual quarters. Their predicted annual growth rates have fallen 0.186 percentage points, whereas growth rates calculated using a geometric average of predicted quarterly rates have fallen 0.126 percentage points. As a consequence, calculated annual growth went from being higher than reported annual growth to being lower.
Solid predicted growth in Q2 outweighed the lackluster economic performance of the first quarter. The significant drop in the first quarter reflects the advanced estimate of GDP reported by the BEA in April. This innaugural post on the Wall Street Journal's Economic Forecasting Survey focuses on GDP forecasts. Future posts will examine other forecasted variables and discuss the major factors influencing those forecasts. The monthly survey asks over 50 financial and economic analysts for forecasts of multiple variables over multiple forecasting horizons. Forecasters are asked to provide estimates of Real GDP growth for the upcoming 4-5 quarters and 3-4 years. Since initial announcements of GDP are estimates the survey asks about quarters that have already passed. For example, in the April 2017 survey analysts were asked to offer expectations about first quarter GDP. The official "advance" estimate was announced by the BEA on April 28. This date is after forecasters submitted their forecasts to the WSJ. The advance estimate from the BEA came in at 0.7 percent, well below the forecasters consensus estimate of 1.4 percent. Forecasters may not be far off the actual numbers which will be anounced in several months. In general, the advanced numbers are revised by about half a percentage point (on average), which means the analysts were within a reasonable margin of error (the standard deviation for their forecasts was 0.48). What may be more revealing is digging into the revisions that the analysts themselves make from month to month. Below is a table of the consensus estimates and their change from March and April for all four quarters of 2017, as well as the annual growth for all of 2017. 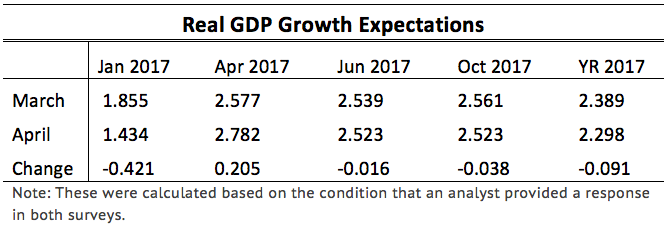 We see that the analysts made downward revisions (not one analyst increased their projection) of Q1 GDP, but increased Q2 GDP. The net effect was a slight drop in projected annual GDP growth. While the March and April numbers appear unchanged, they also fell slightly, but not enough to significantly impact annual growth.
That cohesive story breaks down a bit when one calculates the implied annual growth given by the quraterly growth rates. The consensus growth for 2017 in March was 2.37 percent while in April it increased to 2.53 percent for an average change of 0.151 percentage points. This suggests that analysts form forecasts over different time scales independently. That is, the forecast they make about annual GDP uses different information than the forecasts of each quarter leading to that total annual GDP. One way to interpret that is that the analysts see downside risk over the entire year of 2017, but are unsure in which quarter the shock will hit. Based on these forecasting revisions it seems that the most uncertainty resides in the second half of the year. |
Archives
May 2018
Categories
All
|