
 RSS Feed
|
The August WSJ forecasts are out, and it is another mixed bag, though mostly negative. On the positive side, third and fourth quarter GDP forecasts went up by a tenth of a percent. Forecasts for unemployment through 2019 all went down and payrolls employment increased slightly. However, annual growth for both 2017 and 2018 ticked down slightly. In addition, all the consensus federal funds rate forecasts decreased, indicating lower expectations for the future job markets. This coincides with lower expectations for inflation through 2019. 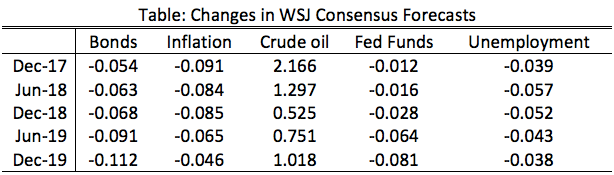 These changes in forecasts reflect the recent low inflation numbers, despite the upbeat employment report. St. Louis Fed President Jim Bullard recently commented on inflation and current monetary policy, which provides a window into the subdued outlook by the WSJ forecasters. In Bullard's view, low commodity (mostly oil) prices have been having the greatest impact on headline inflation, which, he believes, will outweigh any impact of any future improvements in the job market.
If we take that insight as given, the WSJ forecasters are predicting increase in oil prices (and housing prices) over the coming years. Should those increases materialize, the Fed might final realize their two percent target inflation rate.
1 Comment
The recent release of second quarter GDP growth came in below WSJ expectations as well as a downward revision of first quarter growth (from 1.4 to 1.2). This new data follows weak inflation numbers from last week. 1. For the past two years expectations exhibit an upward bias. Which, if that bias holds true, means low future expected growth would indicate even lower actual growth. Projected growth in 2018 is 2.38 percent, and 1.94 percent in 2019. These are significantly below the administrations overly optimistic 3 percent promise. 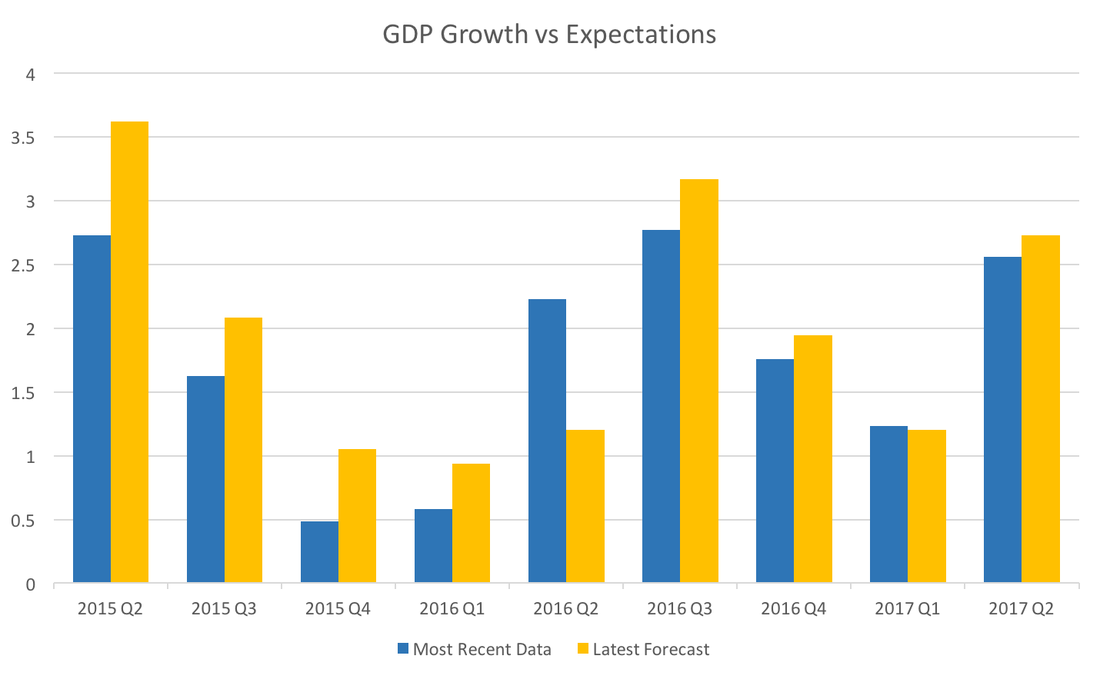 2. Expected federal funds rates have been falling since the beginning of the year. Not by a lot, but it has been consistent, suggesting that new data will give the Fed pause in increasing their target rates. 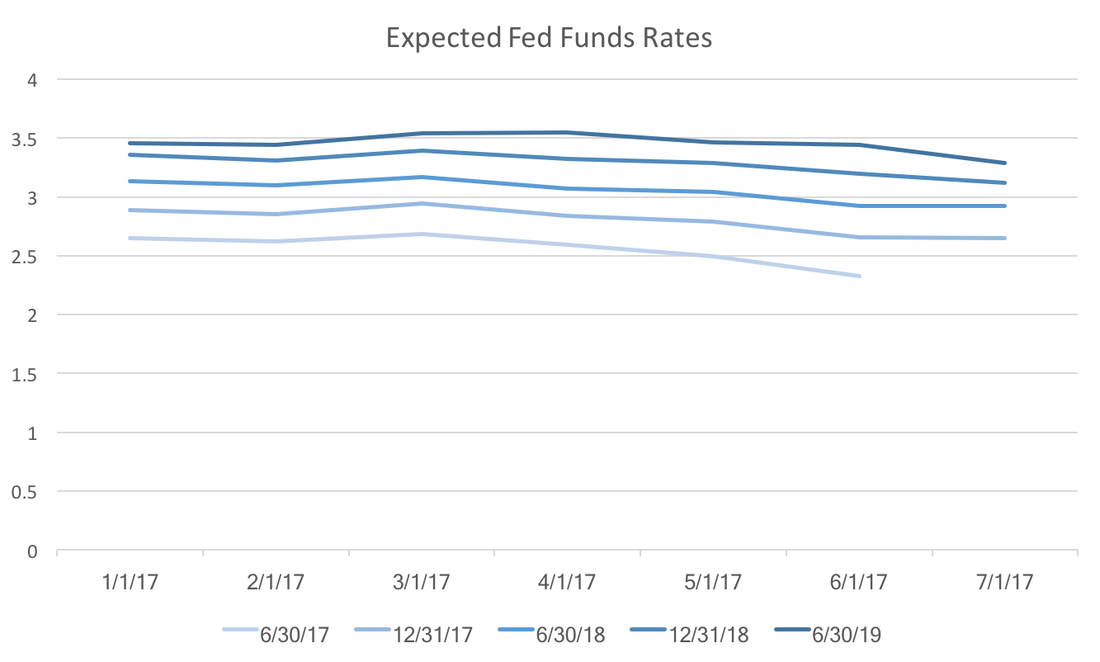 3. Expected housing starts continue to fall. At the beginning of 2016 expected housing starts were quite robust, however, subsequent data have curtailed consensus optimism. If this expectation falls below 1200, that could be a signal the beginnings of a slow down in the housing market. 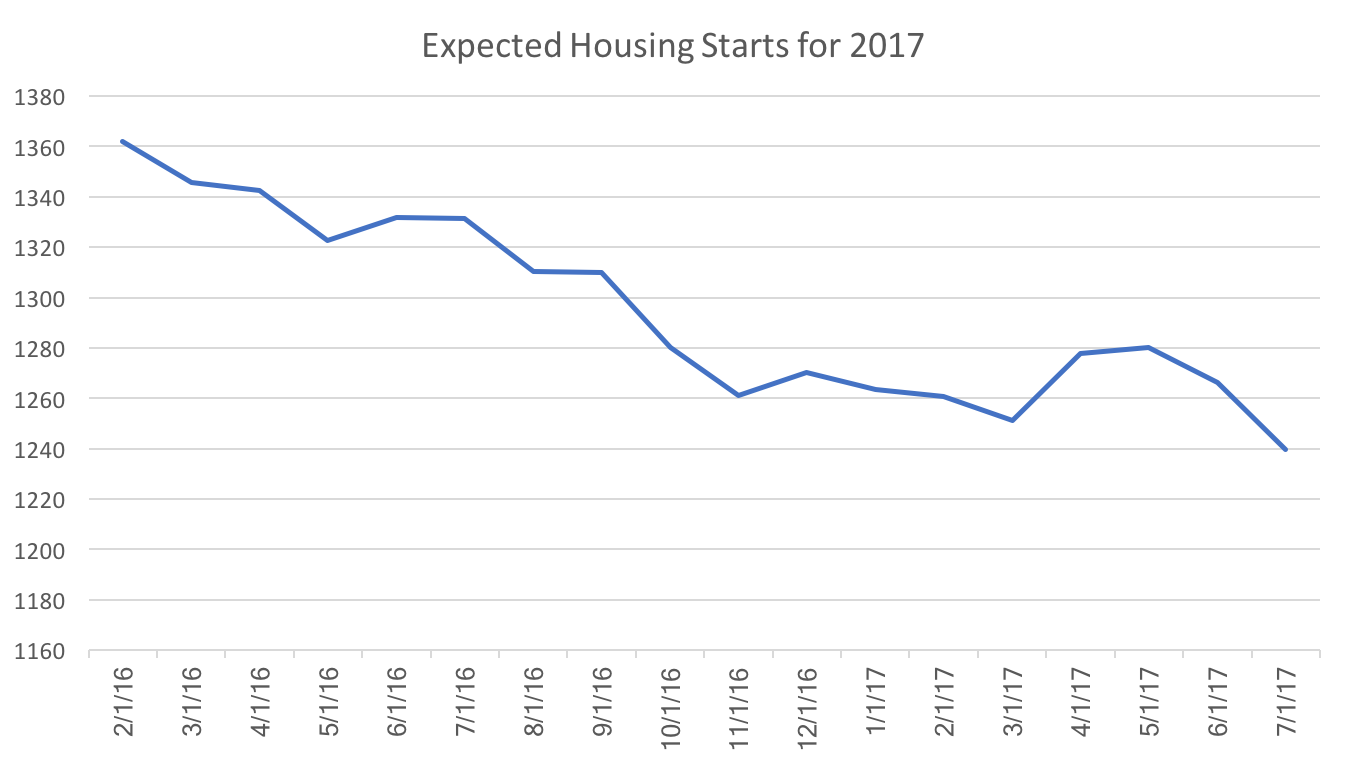 While there some signs of growth remain, these three sets of expectations should worry investors and the current administration. All indicate at the very least, that the economy will not grow particularly quickly in the coming year. In the worst case scenario we may see the beginnings of a recession by the end of 2018.
The BLS recently released the new CPI and inflation statistics. This signals a weakening economy along the lines of Tim Duy's analysis. As Mark Thoma points out, the Fed does not have a lot room to defend the economy against a recession, and congress seems incapable of doing anything at the moment. The WSJ Economic Forecasters expectations indicate further trouble, since they are above actual inflation, but are dropping: 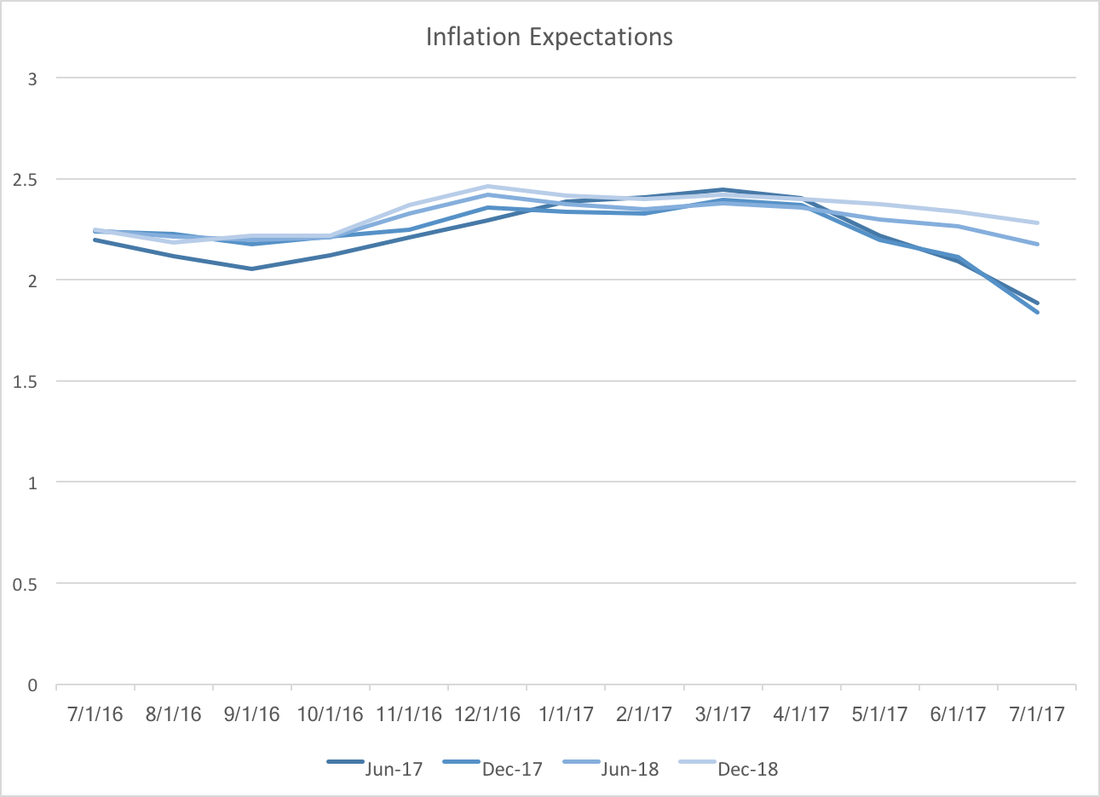 If lower inflation expectations exist in the rest of the economy we can expect slower growth in the coming months. Lower inflation expectations usually are a self fulfilling prophecy, since workers, firms, and households make decisions that reinforce the low inflation future. For example, firms might anticipate lower revenues and therefore lower prices in order to drive up sales.
How do these lower inflation expectations fit into the larger long term picture? Well, the same analysts forecast GDP growth at 2.38 and 1.94 in the 2018 and 2019, respectively. In addition, my previous post on Fed funds rate expectations uncertainty indicates that Federal Reserve credibility (at least in terms of future interest rates) has improved. Inflation expectations for 2017 are low, but expectations for 2018 and 2019 are both firmly above 2 percent. This suggests that analysts believe the economy will slow down in the next two years and that the Fed will take appropriate measures (with what little room they will have) to fend off or minimize a recession. The WSJ economic forecasting survey published mostly good news. Surprisingly, the positive jobs report did little to change forecasts of payroll employment, however it has lowered expectations of a federal funds rate hike by December: 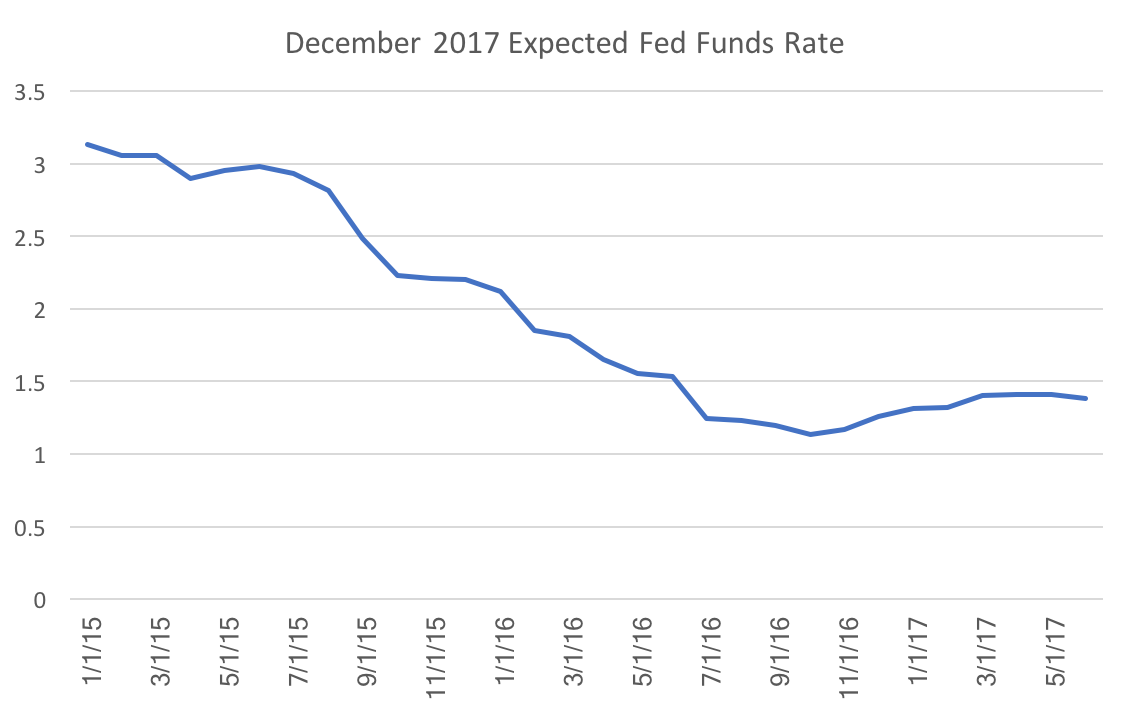 Most of the consensus revisions saw improvements over the next six months to a year, most notably with the probability of a recession dropping by almost one percentage point to 14.77 percent. The consensus also revised oil prices in December down by almost 3.5 dollars to 47.44. Though predicted GDP growth for the year increased slightly, predictions for Q2 fell by 0.2 percentage points to 2.72 percent. The table below summarizes the changes in forecasts for some key variables. 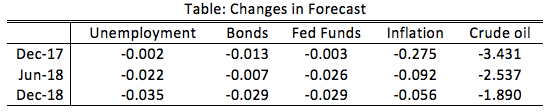 Inflation revisions seem correlated with significant drops in crude oil prices, however the unemployment revisions seem at odds with the federal funds rate revisions. If unemployment is expected to be better, forecasters should be predicting increasing federal funds rates. Perhaps they believe that their lower inflation forecasts imply a more accommodating stance from the Fed.
Bill McBride at Calculated Risk, commented on the strength of the recent employment report. Indeed, the news was much rosier than expected. Tim Duy's Fed Watch agreed with market expectations of approximately 170,000 jobs. The WSJ Economic Forecasters expectations were slightly lower at 165,000 and they have typically underestimated payroll employment: 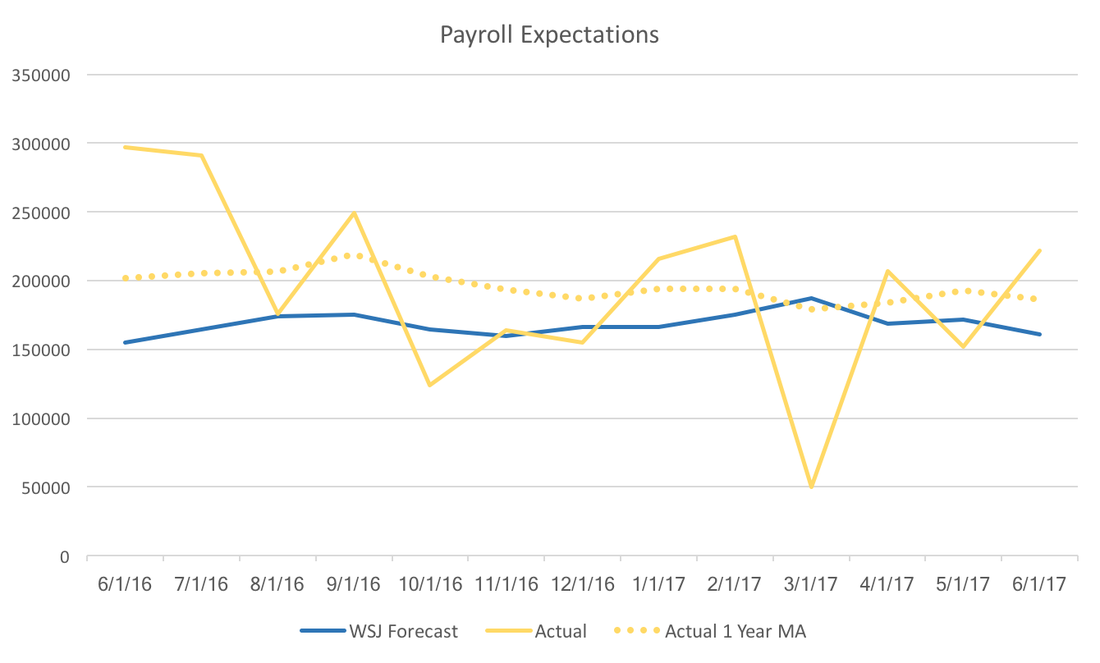 However, the graph above and the graph below hint at the Federal Reserve's continuing conundrum. Payroll employment seems to be consistently beating expectations, but inflation is lower than expected. The WSJ Forecast below is for June 2017 year over year inflation, and the trajectory of actual inflation it seems unlikely that we will break the Fed's two percent target. 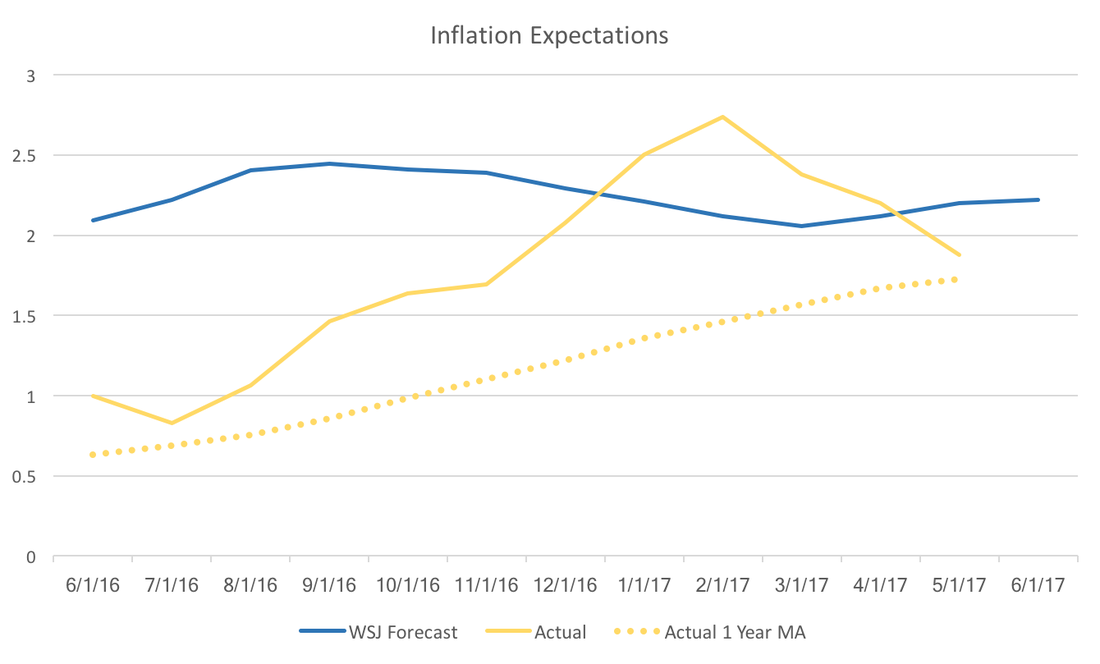 The upcoming release of the July WSJ Economic Forecasts may provide more insight to where market participants think the Fed is heading. It is likely that the jobs report will boost both GDP and fed forecasts, but that relies on forecasters optimistic outlook on inflation.
WSJ Economic Forecast participants report the probability of a recession within the next 12 months. The consensus of the June survey participants has that probability at 16 percent. It appears that Q3 GDP growth appears to play a critical role in forecasters recession probabilities. The table below reports the results of a simple regression. 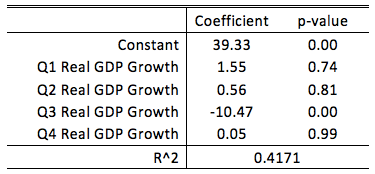 A forecaster who predict zero GDP growth in Q3 would place, on average, a 40 percent probability on the chance of a recession in the next 12 months. For every one percent increase in predicted Q3 GDP growth, that average recession probability would decrease by 10 percentage points. The other quarters do not appear to have a statistical relationship with recession probabilities.
Taken altogether, while a recession does not appear likely to these forecasters, the third quarter plays a pivotal role in these forecasts. The current consensus is 2.6% growth in the third quarter, only slightly below Q2 expectations. If we see weakness leading into the third quarter, we can expect forecasters to start increasing the probability of a recession. Over the past year there has been less disagreement across forecasters predicting the Federal Funds Rate, and unemployment. Not surprisingly as the forecast horizon (the time between the forecast and it's realization) decreases the agreement among forecasters increases. That is, there are fewer outliers because more is known. The WSJ Economic Forecasts display this property, however, using the payrolls employment forecasts we can isolate the changes additional variation outside of the monthly uncertainty. The graph below plots the normalized standard deviations for Employment Payrolls, Inflation, Federal Funds Rate, and Unemployment forecasts. 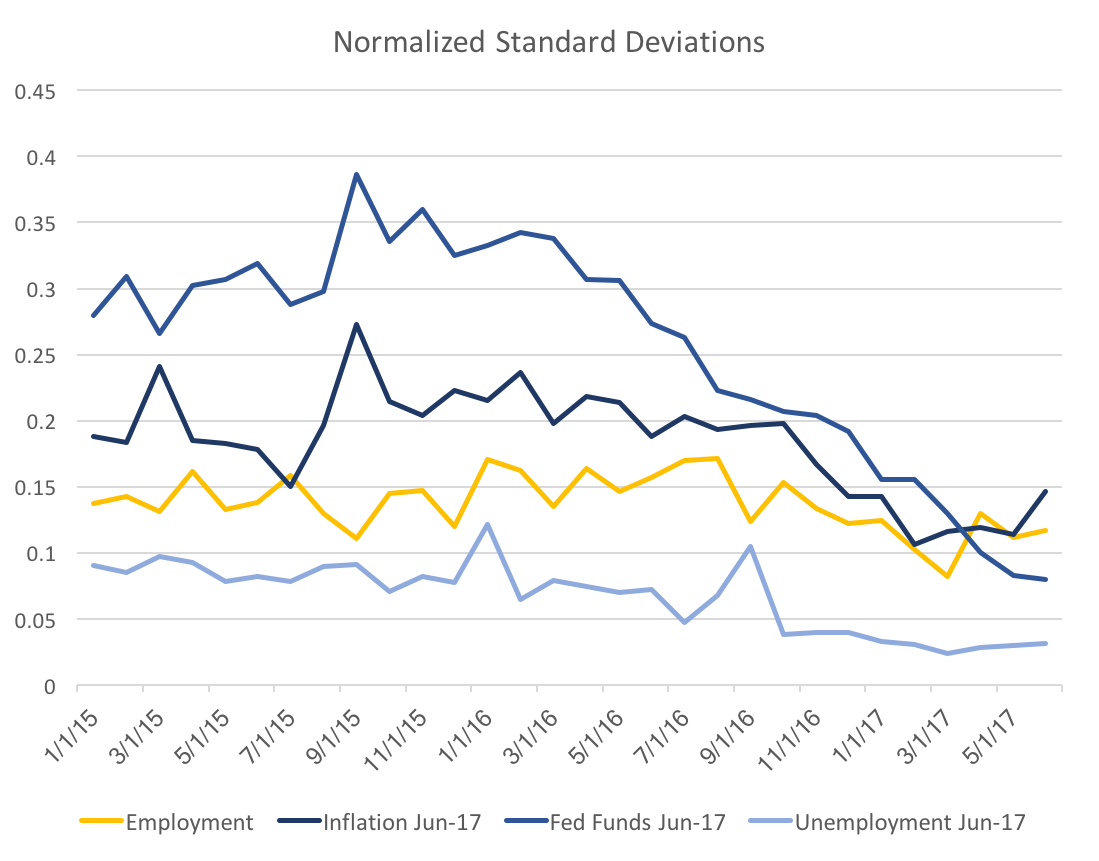 The yellow line of employment payrolls is stable, with a slight decrease in the past half year. In contrast, the Fed Funds Rate exhibits a very steep decline from a year ago. This is likely due to increased consistent messaging amongst FOMC participants as well as improved (and consistent) fundamentals. A large portion of the decrease is likely just due to the shortened horizon. The following graphs will display the forecast variability over all the forecast horizons. 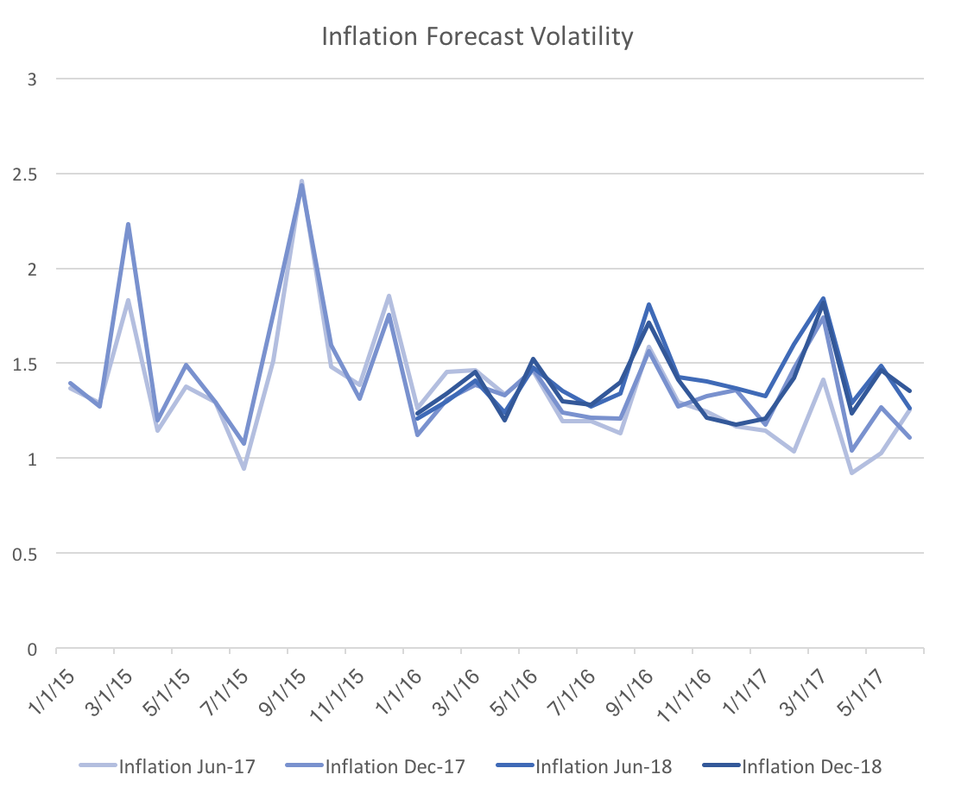 The graph above shows the four forecasts of inflation. Clearly once we control for the general uncertainty the slight downward trend of inflation forecast variability disappears. However, the graph below shows that that the downward trend very strong for the Federal funds rate forecast variability. 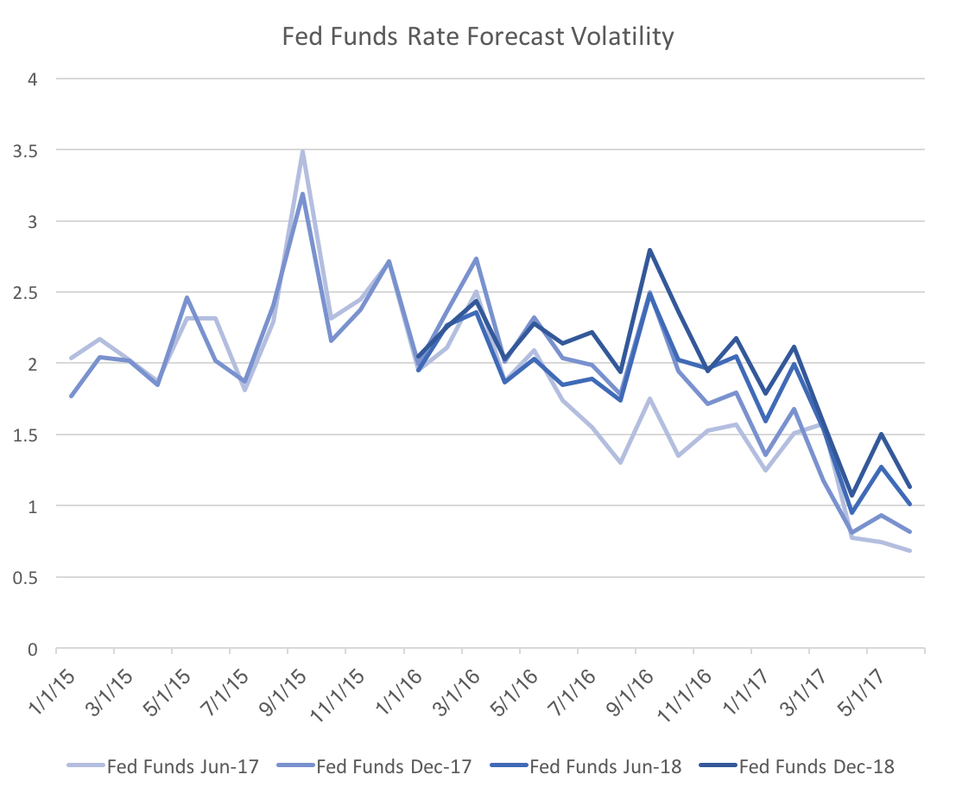 Also note that the drop is across all four forecasted dates, which implies that the result is not a normal change over forecasting horizons. Fed officials should be encouraged by this graph because it suggests the consistent messaging may be consolidating interest rate forecasts. 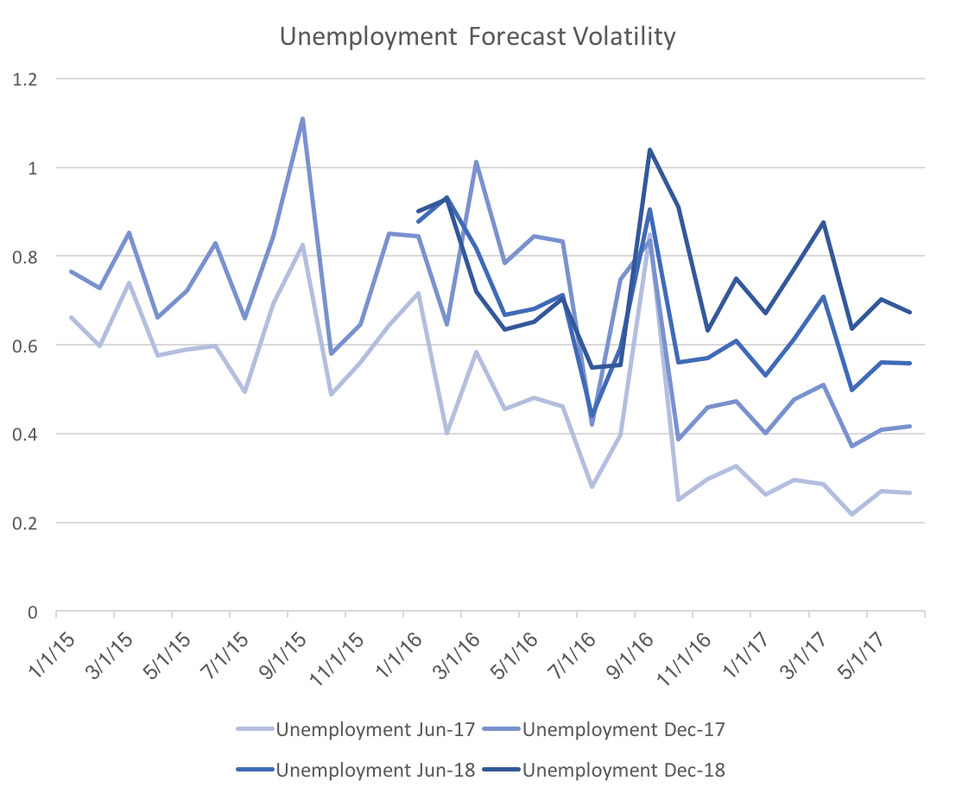 We see a similar, but slightly different graph for unemployment. Again it looks as though all four forecasted dates are decreasing in forecast variability. The main difference is that there is clear stratification across forecast horizons. From this graph it is unclear whether forecasters truly are more certain, however, I suspect the clear stratification across forecast dates indicates a typical spread of forecast horizon uncertainty.
On June 14th the FOMC decided to increase the Federal Funds Rate. This move was almost perfectly anticipated by the WSJ Economic Forecast Survey participants. However, a close look at their revisions to the future rates has them leaving the Fed funds rate mostly unchanged, but seeing significant declines in Ten-year bonds particularly in the short term. The graph below shows the changes in expected interest rates through the end of 2019. 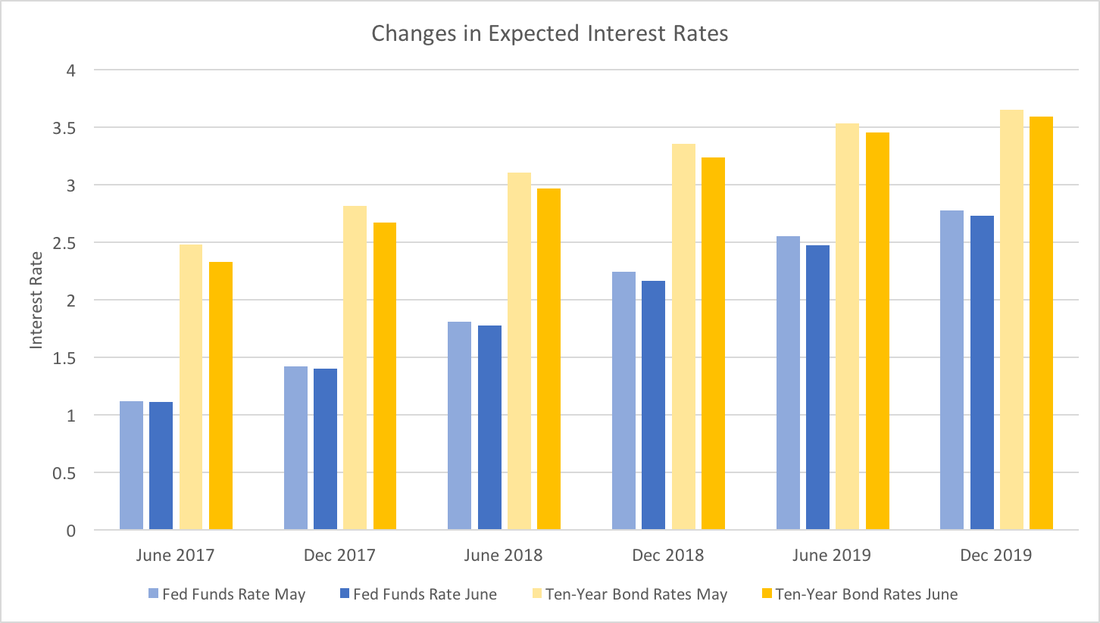 While June and December 2017 Federal funds rates forecasts are almost identical, the Ten-year Bond rates have dropped significantly. This could reflect greater certainty over Fed policy, and less perceived economic risk in the short-term. That is, the Fed has been effectively communicating their criteria for raising rates and participants forecasts have not seen a reason to change the projected path. Since the data have been, for the most part, positive, forecasters believe the bond markets will incorporate the lower economic risk into the bond rates. Taken as a whole, this suggests that expectations about the short-term future economy are good.
Turning to the longer-run (in 2019), both expected rates have dropped slightly. Given the long forecasting horizon it may only reflect reversion to the mean (what goes up must come down). However, I suspect that forecasters recognize that while the economic data has been positive, it has not signaled robust growth. Essentially, we are still (very slowly) climbing out of the hole the financial crisis created and we should continue to do so for the next two years or so. This post examines the WSJ Survey specifically looking at forecasts of the unemployment rate. Compared to previous posts on GDP, Fed Funds Rate, and Economic Risk, forecasters have high expectations for the future unemployment rate. In particular, they have become increasingly optimistic about 2018 relative to 2017. The graph below depicts the average forecasted unemployment rate for each month since December 2015 across June and December in 2017 and 2018. The lines become darker the closer the forecast is to the present. 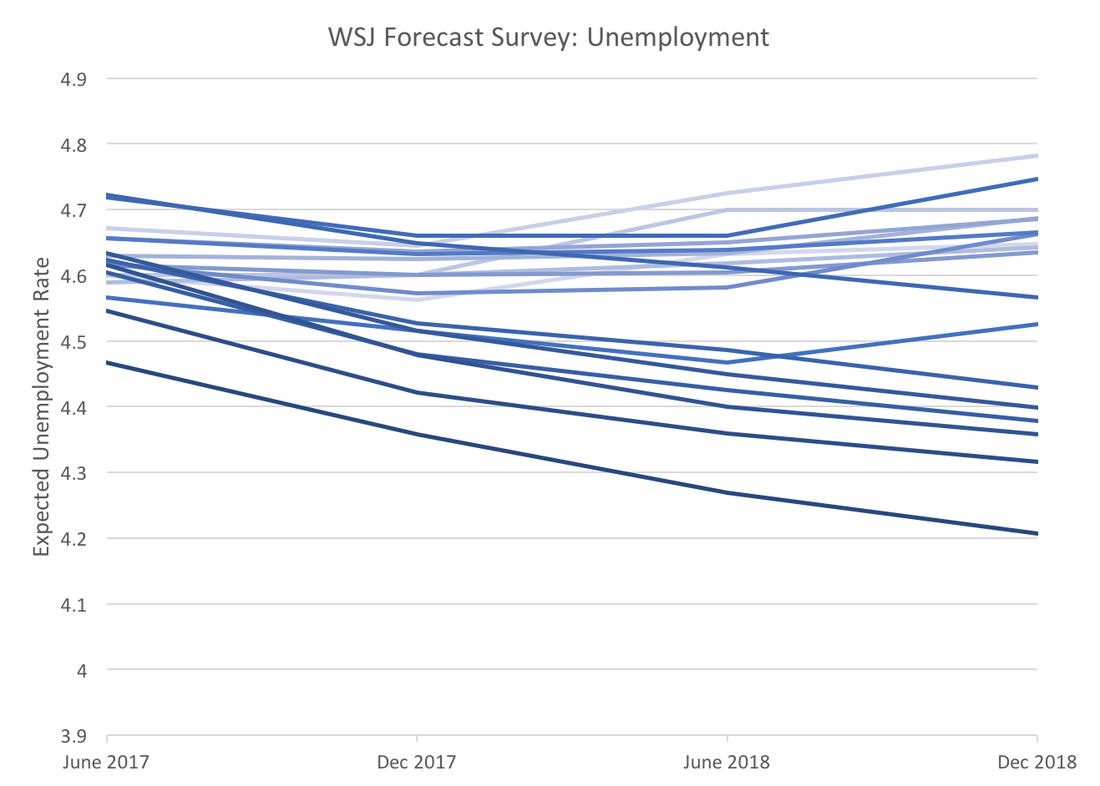 Forecasters are not just becoming optimistic about short-term unemployment, but they are also expecting the trend to continue for a year and a half. A year ago they were expecting the end of 2017 to be the low point in the unemployment rate. The current consensus forecast for December 2018 is 4.21 percent, a rate not seen since prior to the Dot Com bubble, however given the recent unemployment numbers (4.3%) this expectation seems plausible.
The upbeat unemployment forecasts put the more tepid GDP and interest rate forecasts in perspective. More than likely the most recent revisions are an overreaction to the strong April payroll employment numbers. The more recent May payroll and unemployment values send a more mixed message more consistent with previous GDP and interest rate forecasts. The WSJ economic forecasting survey asks for forecasts of ten-year bond rates. Used in conjunction with the Federal Funds Rate we can get a glimpse into whether market participants foresee the yield curve rising or falling over the coming years. A flatter yield curve can suggest two things, slower future economic growth or decreased economic risk. Two caveats to the analysis below: we only have two points on the yield curve and forecasts for bond rates exhibit a lot of variation. With those caveats in mind the graph below depicts the average spread between forecasted ten-year bond rates and the federal funds rate. As the spread gets smaller, the yield curve becomes less steep. Though there is a minor increase forecasted for the end of 2017 the overall trend remain downward. 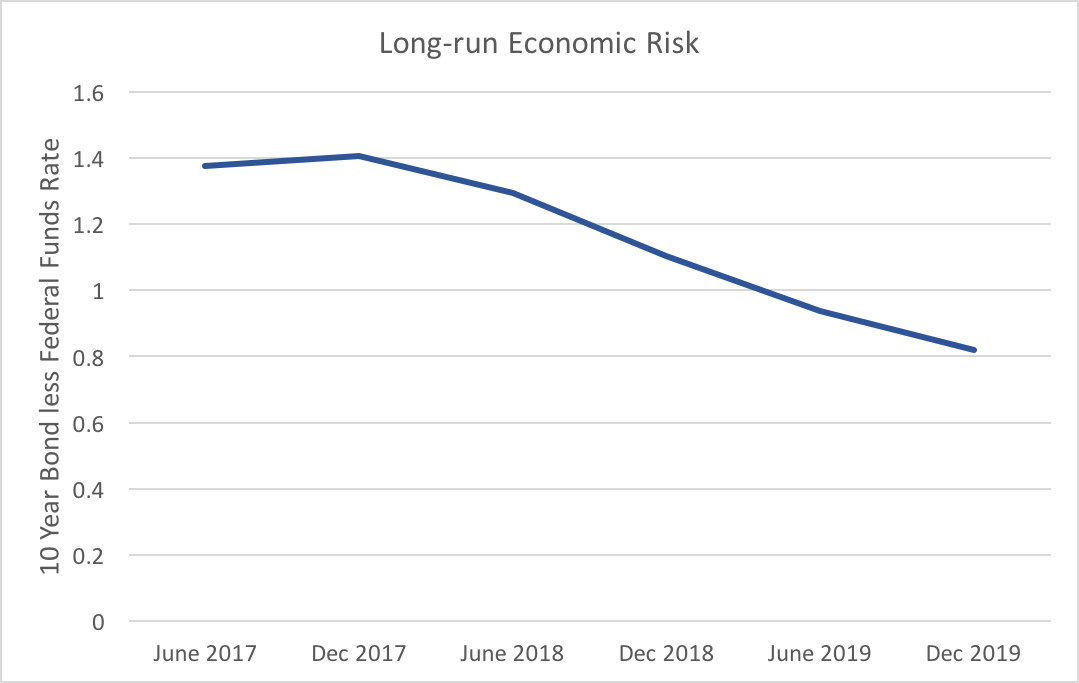 The flattening of the expected yield curve is mostly driven by increases in the Fed funds rate, which is expected to rise 1.66 percentage points from June 2017 to December 2019, whereas ten-year bonds are only expected to rise 1.11 percentage points over the same timeframe. Market participants do not expect the longer end of the yield curve to respond strongly to Fed action.
To reiterate one of the caveats above, while the average of these forecasters shows a definite trend, we see a fair amount of variability. Fifteen percent of participants who provided all forecasts for both ten-year bonds and the federal funds rate expect the yield curve to become more steep. Even though, the consensus clearly points to lower risk and slower future economic growth, that degree of variation provides enough uncertainty to warrant attention to changes in the expected yield curve. |
Archives
May 2018
Categories
All
|